
2019-20 Departmental Plan
Spending and Human Resources
Planned Spending
The Department of Justice’s total planned spending for 2019-20 is $717.9 million:
- $194.9 million for Legal Services (27%);
- $444.9 million for Justice System Support (62%); and
- $78.1 million for Internal Services (11%).
As the primary provider of legal services to other federal government departments and agencies, the Department has a Vote-Netted Revenue Authority to collect and spend revenue received from the provision of such services. For the purpose of departmental reporting, these respendable revenues reduce total departmental authorities and expenditures in Vote 1 (operating expenditures). For comparability purposes, “planned spending” is net of respendable revenues.
Departmental Spending Trend Graph
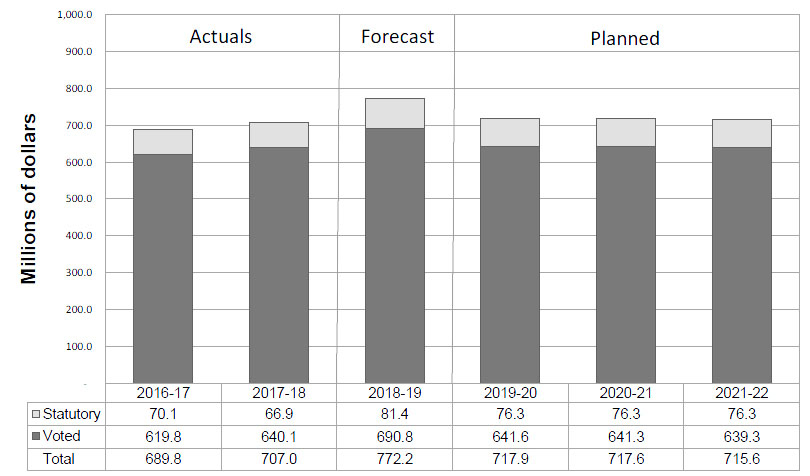
Text version - Departmental spending trend graph
This stacked column graph represents departmental spending trends for six fiscal years for the Department of Justice Canada. The graph presents a timeline (in fiscal years) on the horizontal axis and the amount of dollars (in millions of dollars) on the vertical axis. The timeline on the horizontal axis shows six columns; one for each fiscal year from 2016-17 on the left through to 2021-22. The amount of millions of dollars on the vertical axis ranges from 0 on the bottom to 1,000.0 on the top. Each column displays an accumulated total of departmental spending for two categories of funding: statutory and voted. These two categories of funding are also displayed numerically below each column to indicate the precise dollar amount of funding for each of the six fiscal years presented.
The first column of the timeline, representing fiscal year 2016-17 (actuals), displays a total of $70,100,000 statutory and $619,800,000 voted for a total of $689,800,000. The second column of the timeline, representing fiscal year 2017-18 (actuals), displays a total of $66,900,000 statutory and $640,100,000 voted for a total of $707,000,000. The third column of the timeline, representing fiscal year 2018-19 (forecast), displays a total of $81,400,000 statutory and $690,800,000 voted for a total of $772,200,000. The fourth column of the timeline, representing fiscal year 2019-20 (planned), displays a total of $76,300,000 statutory and $641,600,000 voted for a total of $717,900,000. The fifth column of the timeline, representing fiscal year 2020-21 (planned), displays a total of $76,300,000 statutory and $641,300,000 voted for a total of $717,600,000. The sixth and final column of the timeline, representing fiscal year 2021-22 (planned), displays a total of $76,300,000 statutory and $639,300,000 voted for a total of $715,600,000.
| Core Responsibilities and Internal Services | 2016–17 ExpendituresTable note ii | 2017–18 ExpendituresTable note ii | 2018–19 Forecast spendingTable note iii | 2019–20 Main Estimates | 2019–20 Planned spending | 2020–21 Planned spending | 2021–22 Planned spending |
|---|---|---|---|---|---|---|---|
| Legal Services | 186,457,240 | 180,732,263 | 227,410,543 | 194,853,652 | 194,853,652 | 194,920,797 | 194,920,797 |
| Justice System Support | 416,312,567 | 430,621,197 | 451,301,748 | 444,923,893 | 444,923,893 | 445,030,079 | 443,030,079 |
| Subtotal | 602,769,807 | 611,353,460 | 678,712,291 | 639,777,545 | 639,777,545 | 639,950,876 | 637,950,876 |
| Internal Services | 87,049,639 | 95,648,611 | 93,531,195 | 78,105,514 | 78,105,514 | 77,676,082 | 77,676,082 |
| Total | 689,819,446 | 707,002,071 | 772,243,486 | 717,883,059 | 717,883,059 | 717,626,958 | 715,626,958 |
- Table note i
-
Financial Resources for Planned Spending are based on Main Estimates and are net of respendable revenues. In addition, planned spending for 2019-20 and beyond exclude all Treasury Board central votes funding (such as severance pay expenditures, parental benefit expenditures, vacation credits payable upon termination of employment, and the Operating Budget Carry Forward).
- Table note ii
-
2016-17 and 2017-18 prior-year expenditures have been realigned from the Program Alignment Architecture (reporting structure until March 31, 2018) to the Departmental Results Framework (core responsibilities) for presentation and comparability purposes. Official results for those years are presented in the Public Accounts of Canada and the Departmental Results Reports of each department.
- Table note iii
-
Forecast as of December 31, 2018.
Budgetary Planning Summary
The fluctuations in forecasted spending in 2018-19 compared to previous year expenditures and future years’ planned spending is partly explained by the impact of one-time retroactive compensation payments related to recently signed and ratified collective agreements.
The variance of $65.2 million between 2018-19 forecasted spending and 2017-18 spending is further explained by increases in contribution spending for programs such as criminal legal aid, immigration and refugee legal aid, the Victims Fund, and the Access to Justice in Both Official Languages Support Fund.
Retroactive compensation payments and funding the Department will receive from Treasury Board Central Votes are not included in future years’ planned spending, which explains the $54.4 million decrease between 2018-19 forecasted spending and 2019-20 planned spending. The planned spending for 2019-20 and future years reflects only funds already approved through the Main Estimates.
| Core Responsibilities and Internal Services | 2019–20 Planned gross spending | 2019–20 Planned gross spending for specified purpose accounts | 2019–20 Planned revenues netted against expenditures | 2019–20 Planned net spending |
|---|---|---|---|---|
| Legal Services | 471,302,652 | 0 | 276,449,000 | 194,853,652 |
| Justice System Support | 444,923,893 | 0 | 0 | 444,923,893 |
| Subtotal | 916,226,545 | 0 | 276,449,000 | 639,777,545 |
| Internal Services | 128,656,514 | 0 | 50,551,000 | 78,105,514 |
| Total | 1,044,883,059 | 0 | 327,000,000 | 717,883,059 |
The Department’s Vote-Netted Revenue Authority (VNR) amounts to $327 million, with a corresponding offset to the Operating Budget. The VNR is notionally distributed between the Legal Services and Internal Services programs. The actual revenues distributed between programs could vary depending on numerous factors such as legal service rates approved by Treasury Board periodically, fluctuation in client departments’ demand for legal services, and the actual amount of revenues collected over or below the authority. As shown in the graph below, the forecasted amount of respendable revenues as of December 31, 2018, for the Department is expected to reach $330.2 million in 2018-19.
Departmental Vote Netted Revenue Trend Graph
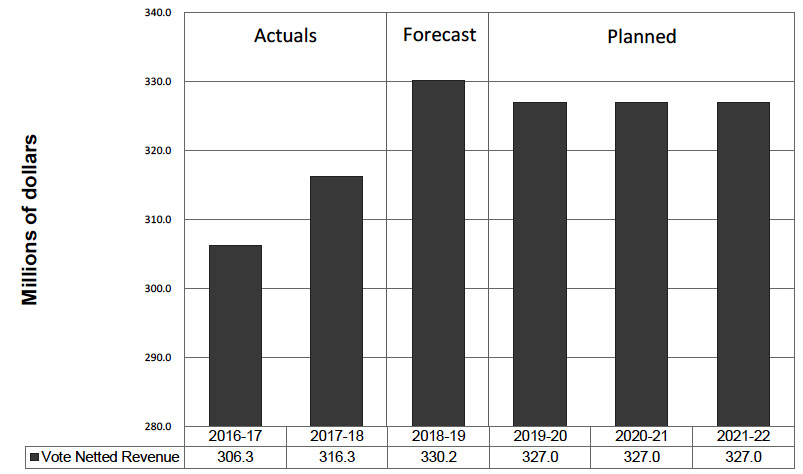
Text version - Departmental Vote Netted Revenue Trend Graph
This column graph represents departmental vote-netted revenue for six fiscal years for the Department of Justice Canada. The graph presents a timeline (in fiscal years) on the horizontal axis and the amount of dollars (in millions of dollars) on the vertical axis. The timeline on the vertical axis shows six columns, with one for each fiscal year from 2016-17 on the left through to 2021-22. The amount of millions of dollars on the vertical axis ranges from 280 million on the bottom to 340 million on the top. Each column displays the amount of vote-netted revenue per fiscal year. This information is also displayed numerically below each column to indicate the precise dollar amount for each of the six fiscal years presented.
The first column of the timeline, representing fiscal year 2016-17 (actuals), displays a total of $306,300,000 in vote-netted revenue. The second column of the timeline, representing fiscal year 2017-18 (actuals), displays a total of $316,300,000 in vote-netted revenue. The third column of the timeline, representing fiscal year 2018-19 (forecast), displays a total of $330,200,000 in vote-netted revenue. The fourth column of the timeline, representing fiscal year 2019-20 (planned), displays a total of $327,000,000 in vote-netted revenue. The fifth column of the timeline, representing fiscal year 2020-21 (planned), displays a total of $327,000,000 in vote-netted revenue. The sixth and final column of the timeline, representing fiscal year 2021-22 (planned), displays a total of $327,000,000 in vote-netted revenue.
Planned Human Resources
| Core Responsibilities and Internal Services | 2016–17 Actual full-time equivalentsTable note iv | 2017–18 Actual full-time equivalentsTable note iv | 2018–19 Forecast full-time equivalentsTable note v | 2019–20 Planned full-time equivalents | 2020–21 Planned full-time equivalents | 2021–22 Planned full-time equivalents |
|---|---|---|---|---|---|---|
| Legal Services | 3,047 | 3,044 | 3,130 | 3,130 | 3,130 | 3,130 |
| Justice System Support | 298 | 296 | 296 | 296 | 296 | 296 |
| Subtotal | 3,345 | 3,340 | 3,426 | 3,426 | 3,426 | 3,426 |
| Internal Services | 966 | 971 | 974 | 974 | 974 | 974 |
| Total | 4,311 | 4,311 | 4,400 | 4,400 | 4,400 | 4,400 |
- Table note iv
-
Prior year FTEs shown have been realigned from the Program Alignment Architecture (reporting structure until March 31, 2018) to the Departmental Results Framework (core responsibilities) for presentation and comparison purposes. Official results for those years are presented in the Departmental Results Reports.
- Table note v
-
Forecast as of December 31, 2018.
Estimates by Vote
Information on the Department of Justice Canada’s organizational appropriations is available in the 2019–20 Main Estimates.
Future-Oriented Condensed Statement of Operations
The Future-Oriented Condensed Statement of Operations provides a general overview of the Department’s operations. The forecast of financial information on expenses and revenues is prepared on an accrual accounting basis to strengthen accountability and to improve transparency and financial management. The forecast and planned spending amounts presented in other sections of the Departmental Plan are prepared on an expenditure basis; as a result, amounts may differ.
A more detailed Future-Oriented Statement of Operations and associated notes, including a reconciliation of the net cost of operations to the requested authorities, are available on Department of Justice’s website.
| Financial information | 2018–19 Forecast results | 2019–20 Planned results | Difference (2019–20 Planned results minus 2018–19 Forecast results) |
|---|---|---|---|
| Total expenses | 1,184,568 | 1,124,762 | (59,806) |
| Total revenues | 333,060 | 327,000 | (6,060) |
| Net cost of operations before government funding and transfers | 851,508 | 797,772 | (53,736) |
- Date modified: