
Profile and Projection of Drug Offences
In Canada
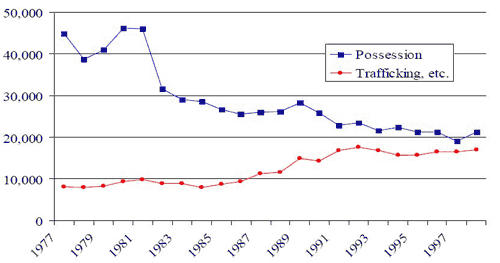
Nature of drug offence by year, Canada, 1977-1998
Prepared by: Research and Statistics Division, Department of Justice Canada
Source: Canadian Centre for Justice Statistics
Description
The figure above is a broken-line graph showing the numbers of charges of drug possession and of drug trafficking, importing and growing in Canada from 1977 to 1998. The X axis shows the year; the Y axis shows the number of charges, in increments of 10,000, from 0 to 50,000. The figure shows two broken lines broken lines: the first (blue, with rectangles) shows the number of charges of drug possession; the second (red, with circles) shows the number of charges of drug trafficking, importing and growing.
The number of charges of drug possession during the period studied ranges from 18,998 to 46,192. It decreases significantly until 1997, when it reaches its lowest level during the period studied at 18,998. It increases slightly in 1998.
Overall, the number of charges of drug trafficking, importing and growing from 1977 to 1998) remains between 7,912 and 17,645. This trend is in contrast to the trend in the number of charges of drug possession, which in fact increases and remains steady at approximately 17,000 until 1998.
- Date modified: