
Profile and Projection of Drug Offences
In Canada
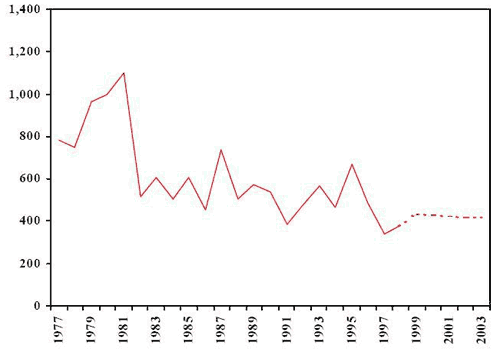
Number of adults charged (historical and projected), Newfoundland, 1977-2003
Prepared by: Research and Statistics Division, Department of Justice Canada
Source: Canadian Centre for Justice Statistics
Description
This figure is a broken line graph showing the number of adults charged in Newfoundland from 1977 to 1998, with a projection (dotted line) from 1999 to 2003. The X axis shows the year; the Y axis shows the number of adults charged, in increments of 200, from 0 to 1,400. Although it is not possible to provide the exact figures, the trend for the period studied appears to be between 350 and 1,100 adults charged.
Between 1977 and 1981, the number of adults charged increases and peaks during this period. This number then drops until 1982, and stabilizes during the following years, with slight increases and decreases from one year to the next. The projection from 1999 to 2003 suggests greater stability with a very slight decrease.
- Date modified: