
Profile and Projection of Drug Offences
In Yukon
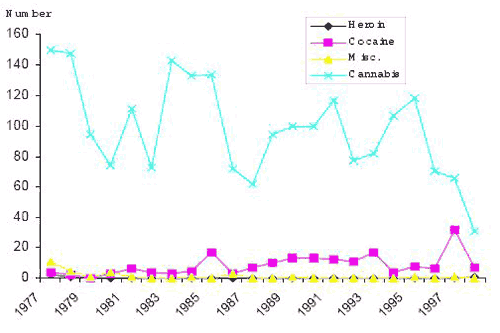
Figure 1. Number of adults charged with drug offences, by drug type, Yukon, 1977-1998
Source : Uniform Crime Reporting Survey (UCR), Canadian Centre for Justice Statistics
Description
Figure 1 above is a broken-line graph showing the number of adults charged with drug offences, by type of drug, in Yukon from 1977 to 1998. The X axis shows the year; the Y axis shows the number of adults charged, in increments of 20, from 0 to 160. There are four broken lines: one (pale blue) showing the number of charges involving cannabis; one (pink) showing the number of charges involving cocaine; one (dark blue) showing the number of charges involving heroin; and one (yellow) showing the number of charges involving other drugs.
The number of charges in connection with cannabis increases and decreases, but decreases overall, from 150 to 31.
The number of charges in connection with cocaine remains low and fairly stable, never exceeding 32.
The numbers of charges in connection with heroin and other drugs are nearly nil, both lines remaining practically flat, never exceeding 11.
- Date modified: