
2021-22 Departmental Plan
Spending and Human Resources
This section provides an overview of the Department’s planned spending and human resources for the next three consecutive fiscal years and compares planned spending for the upcoming year with the current and previous years’ actual spending.
Planned Spending
Departmental Spending 2018-19 to 2023-24
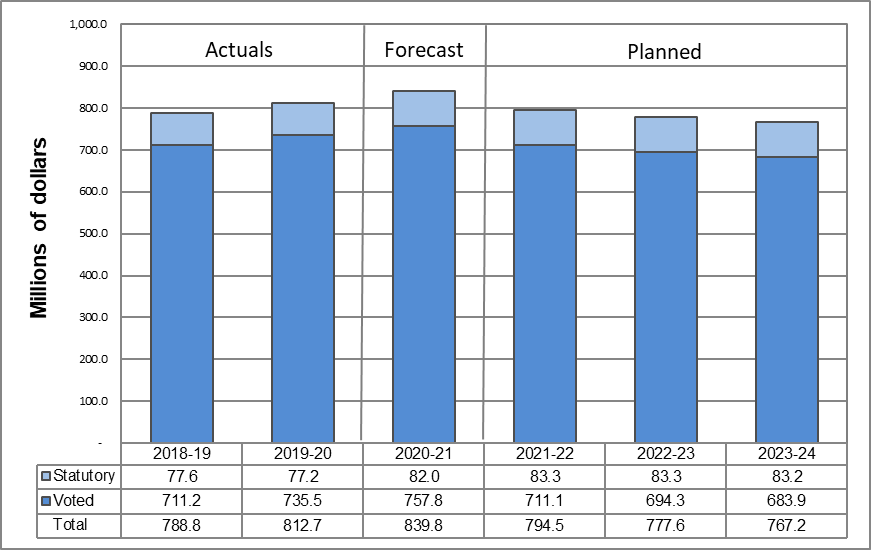
The following graph presents planned (voted and statutory) spending over time.
Text version
This stacked column graph represents departmental spending trends for six fiscal years for the Department of Justice Canada. The graph presents a timeline (in fiscal years) on the horizontal axis and the amount of dollars (in millions of dollars) on the vertical axis. The timeline on the horizontal axis shows six columns; one for each fiscal year from 2018-19 on the left through to 2023-24. The columns for fiscal years 2018-19 and 2019-20 show actual spending, while the column for fiscal year 2020-21 shows forecast spending, and the columns for fiscal years 2021-22 to 2023-24 show planned spending.
The amount of millions of dollars on the vertical axis ranges from 0 on the bottom to 1,000.0 on the top. Each column displays an accumulated total of departmental spending for two categories of funding: statutory and voted. These two categories of funding are also displayed numerically below each column to indicate the precise amount of funding (in millions of dollars) for each of the six fiscal years presented.
The first column of the timeline, representing fiscal year 2018-19, displays $77.6 million in statutory spending and $711.2 million in voted spending, for a total actual spending of $788.8 million.
The second column of the timeline, representing fiscal year 2019-20, displays $77.2 million in statutory spending and $735.5 million in voted spending, for a total actual spending of $812.7 million.
The third column of the timeline, representing fiscal year 2020-21, displays $82.0 million in statutory spending and $757.8 million in voted spending, for a total forecast spending of $839.8 million.
The fourth column of the timeline, representing fiscal year 2021-22, displays $83.3 million in statutory spending and $711.1 million in voted spending, for a total planned spending of $794.5 million.
The fifth column of the timeline, representing fiscal year 2022-23, displays $83.3 million in statutory spending and $694.3 million in voted spending, for a total planned spending of $777.6 million.
The sixth and final column of the timeline, representing fiscal year 2023-24, displays $83.2 million in statutory spending and $683.9 million in voted spending, for a total planned spending of $767.2 million.
The Department of Justice Canada’s total planned spending for 2021-22 is $794.5 million:
- $218.6 million for Legal Services (27%);
- $491.4 million for Justice System Support (62%); and
- $84.5 million for Internal Services (11%).
As the primary provider of legal services to other federal government departments and agencies, the Department has a Vote-Netted Revenue (VNR) authority to collect and spend revenue received from the provision of such services (respendable revenue). For the purpose of departmental reporting, these respendable revenues reduce total departmental authorities and operating expenditures. For comparability purposes, “planned spending” is net of respendable revenues.
Planned spending for 2021-22 ($794.5 million) is expected to decrease by $45.3 million compared to forecast spending for 2020-21 ($839.8 million). This decrease is mainly attributable to additional funding the Department received in 2020-21 from Treasury Board Central Votes (such as the Operating Budget Carry Forward) that are not included in future years’ planned spending. The planned spending for 2021-22 and future years reflects only funds already approved through the Main Estimates. The remainder of the variance is explained by a reduction in Grants and Contributions funding in 2021-22 when compared to the forecast for 2020-21, which included one-time funding for immigration and refugee legal aid to address pressures in 2020-21 (Economic and Fiscal Snapshot 2020).
Planned spending for 2022-23 ($777.6 million) is expected to decrease by $16.9 million compared to planned spending for 2021-22 ($794.5 million), which is mainly explained by the sunset of additional temporary contributions funding for immigration and refugee legal aid received under the initiative Enhancing the Integrity of Canada’s Borders and Asylum System (Budget 2019).
Budgetary Planning Summary for Core Responsibilities and Internal Services (dollars)
The following table shows actual, forecast and planned spending for each of the Department of Justice Canada’s core responsibilities and Internal Services for the years relevant to the current planning year.
| Core Responsibilities and Internal Services | 2018-19 Expenditures |
2019-20 Expenditures |
2020-21 Forecast SpendingFootnote * of Table |
2021-22 Budgetary Spending (as indicated in Main Estimates) | 2021-22 Planned SpendingFootnote ** of Table |
2022-23 Planned SpendingFootnote ** of Table |
2023-24 Planned SpendingFootnote ** of Table |
|---|---|---|---|---|---|---|---|
| Legal Services | 243,874,771 | 223,737,181 | 232,793,998 | 218,606,709 | 218,606,709 | 219,082,931 | 218,460,309 |
| Justice System Support | 448,180,851 | 485,250,753 | 506,125,044 | 491,424,229 | 491,424,229 | 474,142,197 | 464,528,633 |
| Subtotal | 692,055,622 | 708,987,934 | 738,919,042 | 710,030,938 | 710,030,938 | 693,225,128 | 682,988,942 |
| Internal Services | 96,751,723 | 103,733,100 | 100,877,301 | 84,439,375 | 84,439,375 | 84,395,769 | 84,161,583 |
| Total | 788,807,345 | 812,721,034 | 839,796,343 | 794,470,313 | 794,470,313 | 777,620,897 | 767,150,525 |
In the table above, the Legal Services core responsibility shows a decrease in expenditures from 2018-19 to 2019-20, which is mainly attributable to retroactive compensation payments and salary increases from various collective agreements that were signed and ratified in 2018-19.
The Justice System Support core responsibility shows an increasing trend from 2018-19 to 2020-21, which is mainly attributable to an increase in spending in Grants and Contributions for programs such as the Immigration and Refugee Legal Aid Program, the Justice Partnership and Innovation Program, and the Legal Advice for Complainants of Workplace Sexual Harassment Program. The decreasing trend in Justice System Support planned spending for future years is mainly explained by the sunset of temporary contributions funding for immigration and refugee legal aid received under the initiative Enhancing the Integrity of Canada’s Borders and Asylum System (Budget 2019).
Internal services spending from 2018-19 to 2020-21 has remained relatively stable; the small fluctuations are mainly explained by the increased workforce to manage the challenges related to the Phoenix Pay System. The decrease in planned spending in Internal Services for 2021-22 and future years is explained by the fact that planned spending does not include a forecast of funding from Treasury Board Central Votes (such as the Operating Budget Carry Forward).
2021-22 Budgetary Planned Gross Spending Summary (dollars)
The following table reconciles gross planned spending with net planned spending for 2021-22.
| Core Responsibilities and Internal Services | 2021-22 Planned Gross Spending |
2021-22 Planned Revenues Netted Against Expenditures |
2021-22 Planned Net Spending |
|---|---|---|---|
| Legal Services | 525,688,709 | 307,082,000 | 218,606,709 |
| Justice System Support | 491,424,229 | 0 | 491,424,229 |
| Subtotal | 1,017,112,938 | 307,082,000 | 710,030,938 |
| Internal Services | 144,157,375 | 59,718,000 | 84,439,375 |
| Total | 1,161,270,313 | 366,800,000 | 794,470,313 |
The table above reflects the Department’s planned gross spending for 2021-22, which includes the VNR authority of $366.8 million. The Department’s 2021-22 VNR authority ($366.8 million) has increased by $39.8 million compared to the 2020-21 VNR authority ($327.0 million). This increase is to better align with the expected revenue, which is higher due to the increased legal services rates as a result of the latest ratified collective agreements.
The VNR authority is notionally distributed between the Legal Services core responsibility and Internal Services. The actual revenues distributed between programs could vary depending on numerous factors such as legal service rates approved periodically by Treasury Board, fluctuation in client departments’ demand for legal services, and the actual amount of revenues collected in excess of or less than the authority.
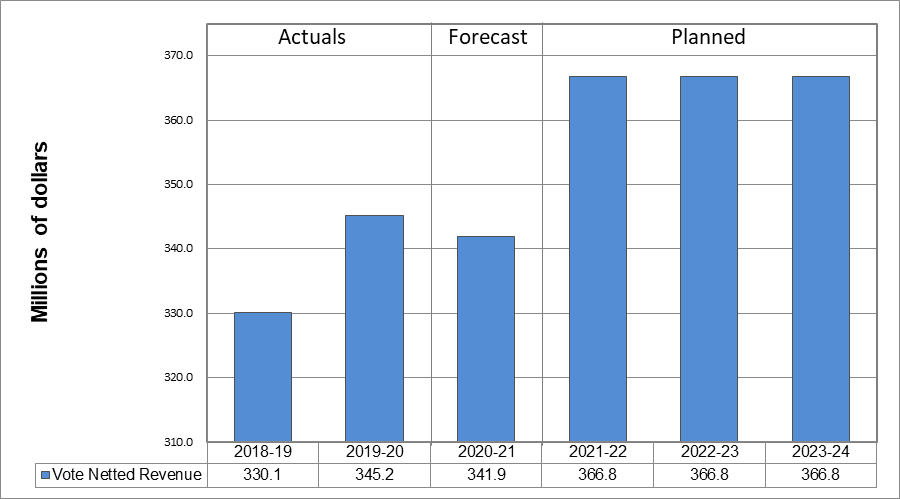
Departmental Vote-Netted Revenue Trend Graph (millions of dollars)
Departmental Vote-Netted Revenue Trend Graph (millions of dollars) – Text version
This column graph represents departmental vote-netted revenue for six fiscal years for the Department of Justice Canada. The graph presents a timeline (in fiscal years) on the horizontal axis and the amount of dollars (in millions of dollars) on the vertical axis. The timeline on the horizontal axis shows six columns; one for each fiscal year from 2018-19 on the left through to 2023-24. The columns for fiscal years 2018-19 and 2019-20 show actual vote-netted revenue, while the column for fiscal year 2020-21 shows forecasted vote-netted revenue and the columns for fiscal years 2021-22 to 2023-24 show planned vote-netted revenue.
The amount of millions of dollars on the vertical axis ranges from 310.0 on the bottom to 370.0 on the top. Each column displays the amount of vote-netted revenue per fiscal year. This information is also displayed numerically below each column to indicate the precise amount of vote-netted revenue (in millions of dollars) for each of the six fiscal years presented.
The first column of the timeline, representing fiscal year 2018-19, displays $330.1 million in actual vote-netted revenue.
The second column of the timeline, representing fiscal year 2019-20, displays $345.2 million in actual vote-netted revenue.
The third column of the timeline, representing fiscal year 2020-21, displays $341.9 million in forecasted vote-netted revenue.
The fourth, fifth and sixth columns of the timeline, representing fiscal years 2021-22 to 2023-24, each display $366.8 million in planned vote-netted revenue.
As shown in the graph above, the forecasted amount of VNR for the Department, as of October 31, 2020, is expected to reach $341.9 million in 2020-21. This forecast is lower than originally anticipated due to the impacts of the COVID-19 pandemic and the reduced operations of courts and tribunals which directly impacts the provision of legal services, mostly litigation services, within the government.
Planned Human Resources
The following table shows actual, forecast and planned full-time equivalents (FTEs) for each core responsibility in the Department of Justice Canada’s departmental results framework and Internal Services for the years relevant to the current planning year.
Human Resources Planning Summary for Core Responsibilities and Internal Services
| Core Responsibilities and Internal Services | 2018-19 Actual Full-Time Equivalents |
2019-20 Actual Full-Time Equivalents |
2020-21 Forecast Full-Time EquivalentsFootnote * of Table |
2021-22 Planned Full-Time Equivalents |
2022-23 Planned Full-Time Equivalents |
2023-24 Planned Full-Time Equivalents |
|---|---|---|---|---|---|---|
| Legal Services | 3,122 | 3,243 | 3,370 | 3,370 | 3,370 | 3,370 |
| Justice System Support | 291 | 284 | 308 | 308 | 308 | 308 |
| Subtotal | 3,413 | 3,527 | 3,678 | 3,678 | 3,678 | 3,678 |
| Internal Services | 973 | 1,043 | 1,042 | 1,042 | 1,042 | 1,042 |
| Total | 4,386 | 4,570 | 4,720 | 4,720 | 4,720 | 4,720 |
Overall, there is an increasing trend in FTEs over the three-year period from 2018-19 to 2020-21. The Legal Services core responsibility shows an increase of 248 FTEs; this is largely explained by increasing demand for litigation for a broad variety of client departments and agencies in such areas as tax, Indigenous, and immigration matters. Internal Services shows an increase of 69 FTEs; this is mainly explained by workforce growth in Human Resources Management Services to continue managing the challenges related to the Phoenix Pay System, and workforce growth in other areas providing corporate support (such as Communication Services, Information Technology Services and Real Property Management Services). The FTEs for the Justice System Support core responsibility have remained relatively stable.
Estimates by Vote
Information on the Department of Justice Canada’s organizational appropriations is available in the 2021-22 Main EstimatesEndnote xc.
Future-Oriented Condensed Statement of Operations
The Future-Oriented Condensed Statement of Operations provides an overview of the Department of Justice Canada’s operations for 2020-21 to 2021-22.
The amounts for forecast and planned results in this statement of operations were prepared on an accrual basis. The amounts for forecast and planned spending presented in other sections of the Departmental Plan were prepared on an expenditure basis. Amounts may therefore differ.
A more detailed Future-Oriented Statement of Operations and associated notes, including a reconciliation of the net cost of operations to the requested authorities, are available on the Department of Justice Canada’s websiteEndnote xci.
Future-Oriented Condensed Statement of Operations for the Year Ending March 31, 2022 (thousands of dollars)
| Financial Information | 2020-21 Forecast Results |
2021-22 Planned Results |
Difference (2021-22 Planned Results minus 2020-21 Forecast Results) |
|---|---|---|---|
| Total Expenses | 1,296,931 | 1,255,500 | (41,431) |
| Total Revenues | 341,901 | 366,800 | 24,899 |
| Net Cost of Operations Before Government Funding and Transfers | 955,030 | 888,700 | (66,330) |
Total expenses are forecasted to decrease from $1,296.9 million in 2020-21 to $1,255.5 million as planned in 2021-22 (a decrease of $41.4 million). A portion ($20.4 million) of this decrease is mainly due to:
- a decrease in contributions expenditures for the Immigration and Refugee Legal Aid Program in 2021-22; and
- a decrease in operating expenditures, which is primarily explained by funding received in 2020-21 from Treasury Board Central Votes (Operating Budget Carry-Forward) being included in the 2020-21 forecast, but excluded from 2021-22 planned spending.
The variance in revenues from $341.9 million to $366.8 million (increase of $24.9 million) is attributable to the difference between the latest revenue forecast for 2020-21 and the approved Vote-Netted Revenue authority in 2021-22.
- Date modified: