
Profile and Projection of Drug Offences
In Canada
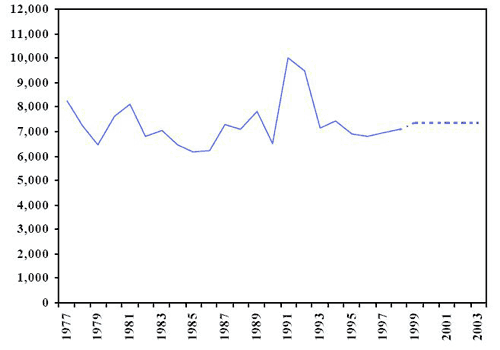
Number of adults charged (historical and projected), British Columbia, 1977-2003
Prepared by: Research and Statistics Division, Department of Justice Canada
Source: Canadian Centre for Justice Statistics
Description
The figure above is a broken-line graph showing the number of adults charged in British Columbia from 1977 to 1998, with a projection (dotted line) from 1999 to 2003. The X axis shows the year; the Y axis shows the number of adults charged, in increments of 1,000, from 0 to 12,000. The number of adults charged during the period studied is between 6,194 and 10,001.
The number remains stable despite a few fluctuations until 1990, and then peaks at approximately 10,000 in 1991. However, it decreases to approximately the same level as in the early 1980s, that is, between 7,000 and 8,000. The projection suggests stability at that level from 1999 to 2003.
- Date modified: