
Profile and Projection of Drug Offences
In Canada
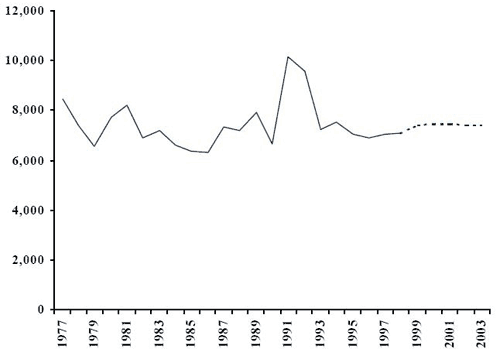
Number of adults charged (historical and projected), Pacific Region, 1977-2003
Prepared by: Research and Statistics Division, Department of Justice Canada
Source: Canadian Centre for Justice Statistics
Description
The figure is a broken-line graph showing the number of adults charged in the Pacific Region from 1977 to 1998, with a projection (dotted line) from 1999 to 2003. The X axis shows the year; the Y axis shows the number of adults charged, in increments of 2,000, from 0 to 12,000. Although the figure does not provide the exact number, overall, the number of adults charged during the period studied is between approximately 6,304 and 10,130.
From 1977 to 1990, the number of adults charged remains fairly stable, fluctuating between 6,200 and 8,200. It then increases, peaking in 1991. It then decreases, returning to the trend of previous years from 1977 to 1990. It then remains at approximately the same level. The projection suggests probable stability from 1999 to 2003.
- Date modified: