
Profile and Projection of Drug Offences
In Canada
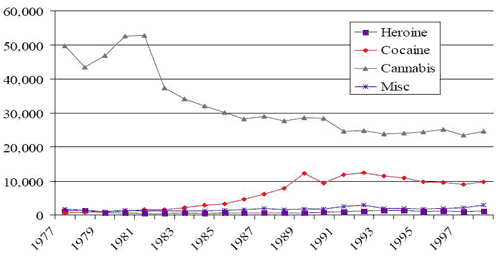
Type of drug by year, Canada, 1977-1998
Prepared by: Research and Statistics Division, Department of Justice Canada
Source: Canadian Centre for Justice Statistics
Description
The figure above is a broken-line graph showing the number of adults charged in Canada, by drug, from 1977 to 1998. The X axis shows the year; the Y axis shows the number of charges, in increments of 10,000, from 0 to 60,000. Four broken lines show the number of charges involving drugs: cannabis (pale blue line), cocaine (pink line), heroin (dark blue line) and other drugs (yellow line).
The number of charges in connection with cannabis ranges from 23,498 to 52,810. From 1977 to 1982, it remains high and stable. It decreases starting in 1983, and then stabilizes around 1992 at a level between 24,000 and 25,000, where it remains in 1998.
The number of charges in connection with cocaine fluctuates between 619 and 12,356 from 1977 to 1998. In 1977, the number is at its lowest level (619). It increases until 1990, when it peaks during the period studied at 12,356. It then decreases and remains at approximately 10,000 until 1998.
The numbers of charges in connection with heroin and other drugs are quite similar, and vary during the period studied from 377 to 2,896. Both these numbers, particularly the number of charges involving heroin, are fairly stable and remain at a very low level.
- Date modified: