
4. Findings
The following section examines trends in the use of EJMs at the policing stage between 2010 and 2021. Findings are presented by five key research questions:
- To what extent were youth who come in contact with the police diverted by an EJM?;
- Which types of EJMs are the most and least frequently used?;
- How does the use of EJMs vary according to offence type?;
- How does the use of EJM vary between urban and rural regions?; and
- Are there jurisdictional differences in the use of EJMs?
4.1 To what extent are youth who come in contact with the police diverted by EJMs?
Data on youth not charged includes instances where youth who come in contact with the police are cleared by EJMs (diverted) and where youth are cleared by other means. Youth who are diverted by EJMs include instances where instead of a charge, police opted for a verbal warning, a written caution, a referral to a community program, or an extrajudicial sanctions program. Disaggregated data on the use of theses specific EJMs are available and presented in the next sub-section (Section 4.2).
Data on youth cleared by other means include instances where the police officer decided to take no further action (a form of EJM), as well as other non-EJM instances as listed in the Limitations section. Since this type of EJM (take no further action) cannot be disaggregated from other non-EJM instances, the data on youth cleared by other means are presented below separately from data on youth diverted by EJMs.
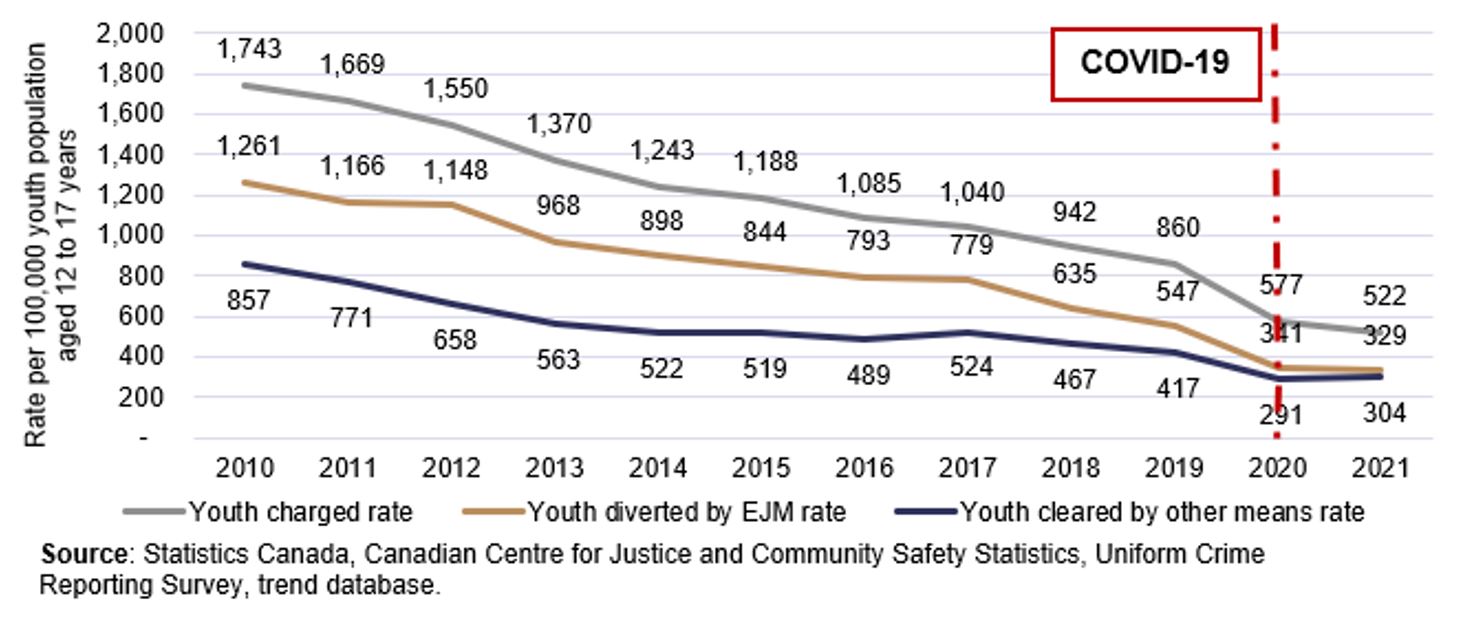
The rate of youth diverted by EJMs decreased from 2010 to 2021, mirroring the decreasing trend in youth crime
Similar to the youth crime rate, which decreased over time (-68% from 2010 to 2021), the rate of youth diverted by EJMs also decreased, by 74% from 1,261 per 100,000 youth in 2010 to 329 per 100,000 youth in 2021 (see Chart 2). A similar trend was found for the rate of youth cleared by other means, which decreased 65%, from 857 per 100,000 youth in 2010 to 304 per 100,000 in 2021. The only exceptions to this decreasing trend were in 2017 and 2021 when slight increases in the rate of youth cleared by other means were noted (+7% from 2016 and +4% from 2020, respectively).
Chart 2. Youth crime rate, by type of police action, Canada, 2010 to 2021
Text version
This line chart presents the youth crime rate in Canada from 2010 to 2021, broken down by three types of police action. The horizontal axis represents the years from 2010 to 2021. The vertical axis shows the rate of youth per 100,000 population aged 12 to 17.
Three distinct lines are plotted:
- Youth charged rate: This line begins at a high point of 1,743 per 100,000 youth in 2010 and shows a steady and significant decline over the years. By 2021, the rate drops to 522, marking the largest decrease among the three categories.
- Youth diverted by extrajudicial measures (EJM) rate: This line starts at 1,261 in 2010 and also trends downward. The lowest point occurs around the COVID-19 pandemic period, where the rate falls to 341, before slightly increasing to 329 in the final year.
- Youth cleared by other means rate: This line begins at 857 in 2010, lower than the other two categories. It also declines over time, with notable fluctuations. The lowest point is observed around the COVID-19 period at 291, after which the rate stabilizes slightly above the previous low at 304.
A vertical dashed line labeled "COVID-19" marks the year 2020, indicating a period of disruption. Around this time, all three lines show either sharp declines or fluctuations, reflecting the pandemic’s impact on youth crime rates and police responses.
Source: Statistics Canada, Canadian Centre for Justice and Community Safety Statistics, Uniform Crime Reporting Survey, trend database.
From 2010 to 2021, over half of all youth who came in contact with the police were not charged
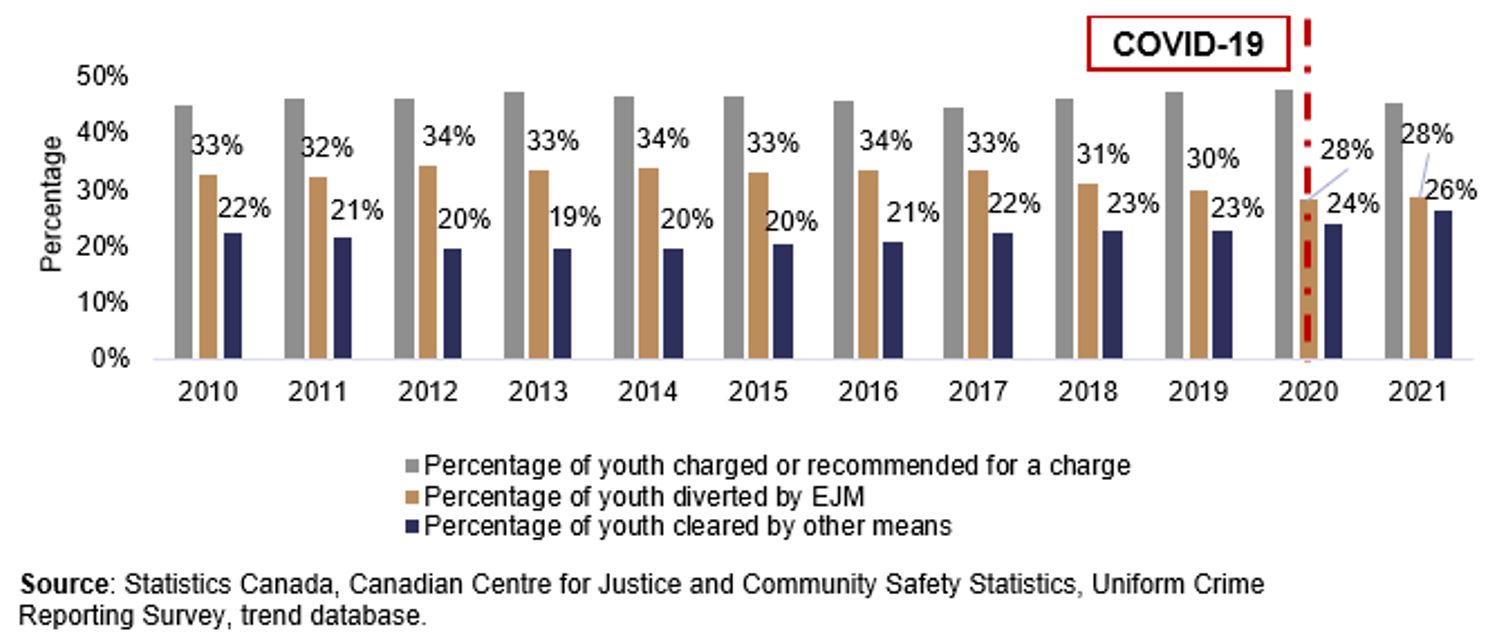
Looking at the two measures combined (youth diverted through EJMs and cleared by other means), on average, over half (54%) of all youth who came in contact with the police were not charged during the study period; this proportion was rather stable over the years, ranging between 52% and 56%.
On average, about one-third of all youth who came in contact with the police were diverted by EJMs from 2010 to 2021; this percentage slowly started to decrease in later years
From 2010 to 2021, on average, almost one-third (32%) of all youth who came in contact with the police were diverted through EJMs. This proportion was rather stable over the years, ranging between 32% and 34% up until 2017, at which point a decreasing trend started, reaching 28% in 2021 (see Chart 3).
From 2010 to 2021, on average, around one in five (22%) youth who came in contact with the police were cleared by other means. Contrary to the decreasing trend observed for EJMs, the percentage of youth cleared by other means showed slow and consistent yearly increases starting in 2015 (20%), and reached over one-quarter (26%) of youth in contact with police in 2021.
Chart 3. Percentage of youth who came in contact with police, by type of police action, Canada, 2010 to 2021
Text version
This vertical bar chart presents the percentage of youth in contact with police in Canada from 2010 to 2021, categorized by three types of police action. The horizontal axis lists each year from 2010 to 2021, while the vertical axis shows percentages ranging from 0% to 50%.
For each year, there are three bars representing:
- Youth charged or recommended for a charge: These bars fluctuate slightly but generally remain in the mid fourties percentage range. There is no clear upward or downward trend.
- Youth diverted by extrajudicial measures (EJM): These bars begin at 33% in 2010 and show a gradual decline over time, reaching 28% in 2020 and 2021. This category experienced the largest overall decrease.
- Youth cleared by other means: These bars also show moderate fluctuations, ranging mostly between 19% and 26%. Like the EJM category, this group sees a significant drop in 2020, followed by a slight recovery in 2021.
Source: Statistics Canada, Canadian Centre for Justice and Community Safety Statistics, Uniform Crime Reporting Survey, trend database.
4.2 Which types of EJMs are the most and least frequently used?
The following section examines the number and percentage of the various types of EJMs used from 2010 to 2021, in an effort to understand which type is most and least frequently used and how these trends have evolved over time. The types of EJMs examined include verbal warnings, written cautions, referrals to a community program and referrals to an extrajudicial sanctions program.
A verbal warning involves police officers having a discussion with the young person and their parents or guardian, and warning them that further law-breaking behaviour may result in formal actions.
Written cautions are more formal warnings that typically involve a letter from the police to the young person and the parents. In certain circumstances, the young person and parents may be required to appear at the police station for an in-person meeting to discuss the incident.
A referral to a community program involves a police officer referring a young person to a program or agency in the community that may assist the young person in not engaging in further criminal behaviour. These community programs can take different forms such as recreational programs, counselling, mental health programs and services, and youth justice committees.
An extrajudicial sanction is a more formal type of EJM and can be applied in accordance with an approved program. Extrajudicial sanctions may be used when a young person cannot be adequately dealt with by other types of EJMs because of the seriousness of the offence, the nature and extent of previously committed offences, or any other aggravating circumstances.Footnote 27 Extrajudicial sanctions consist of conditions that a young person must fulfill outside of the court process. These sanctions may take different forms such as attending specialized programs, making restitution to the victim, and completing community service. To be admitted to an extrajudicial sanctions program, the young person must accept responsibility for the offending behaviour and consent to the use of an extrajudicial sanction.Footnote 28 Additionally, there must be sufficient evidence to support a finding of guilt. The victim(s) of the alleged offence also has a right to be informed.Footnote 29
From 2010 to 2021, verbal warnings were the most frequently used EJM while referrals to a community program were the least frequently used EJM
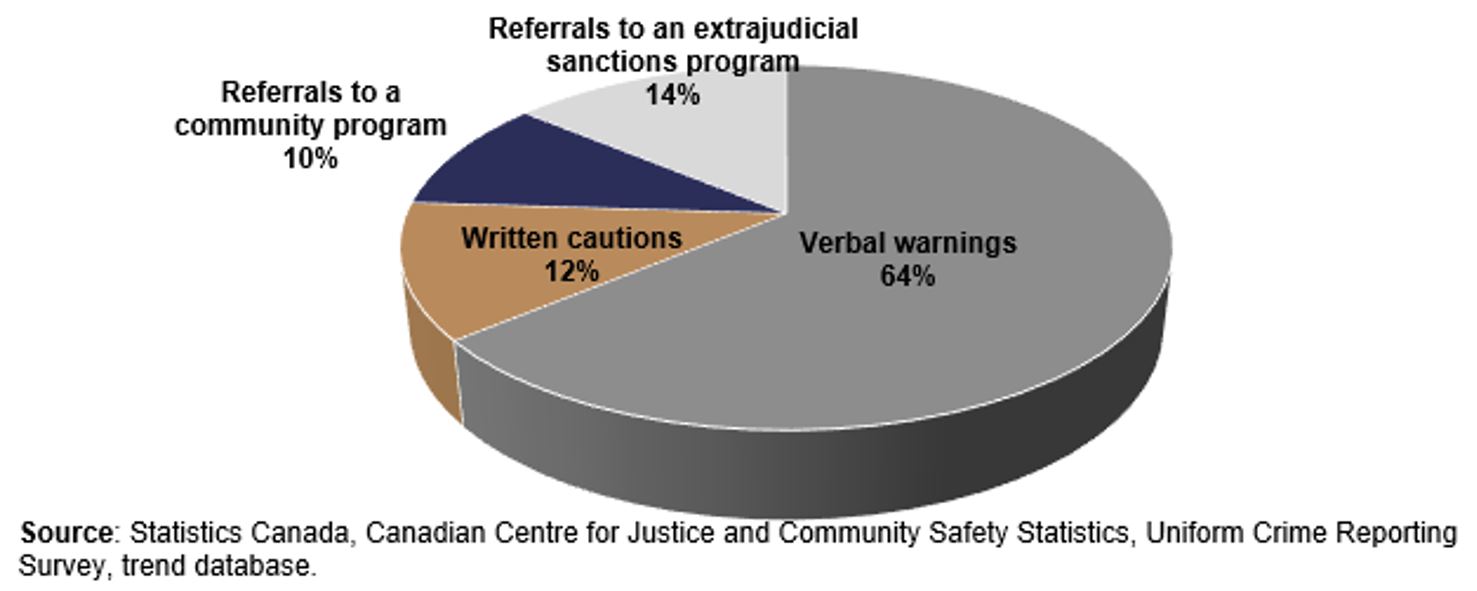
From 2010 to 2021, there were a total of 464,646 youth diverted by EJMs. Of these youth, the majority (two-thirds; 64%; 296,736) were cleared by a verbal warning. The second most frequently used EJM, although much less common, was a referral to an extrajudicial sanctions program (14% of all youth diverted by EJMs; 63,531), followed by a written caution (12%; 57,181). The least frequently used EJM was a referral to a community program, representing one in ten (10%; 47,198) of all youth diverted by EJMs (see Chart 4).
These trends remained consistent throughout the study period, although slight fluctuations were observed which are explored in more details below.
Chart 4. Percentage of youth cleared by EJMs, by type of EJM, Canada, 2010 to 2021
Text version
This pie chart illustrates the distribution of extrajudicial measures (EJMs) used by police to clear youth in Canada between 2010 and 2021. Each section of the chart represents a different type of EJM, with the size of each slice corresponding to its proportion of total EJM cases during this period.
- The largest portion of the chart, accounting for 64%, represents verbal warnings. This indicates that nearly two-thirds of all youth cleared by EJMs received a verbal warning.
- The second-largest category, at 14%, is referrals to an extrajudicial sanctions program.
- Written cautions make up 12% of the total, representing a more documented response.
- The smallest category, at 10%, is referrals to a community program.
Source: Statistics Canada, Canadian Centre for Justice and Community Safety Statistics, Uniform Crime Reporting Survey, trend database.
Verbal warnings was the most frequently used EJM across all years, reaching its peak in 2021
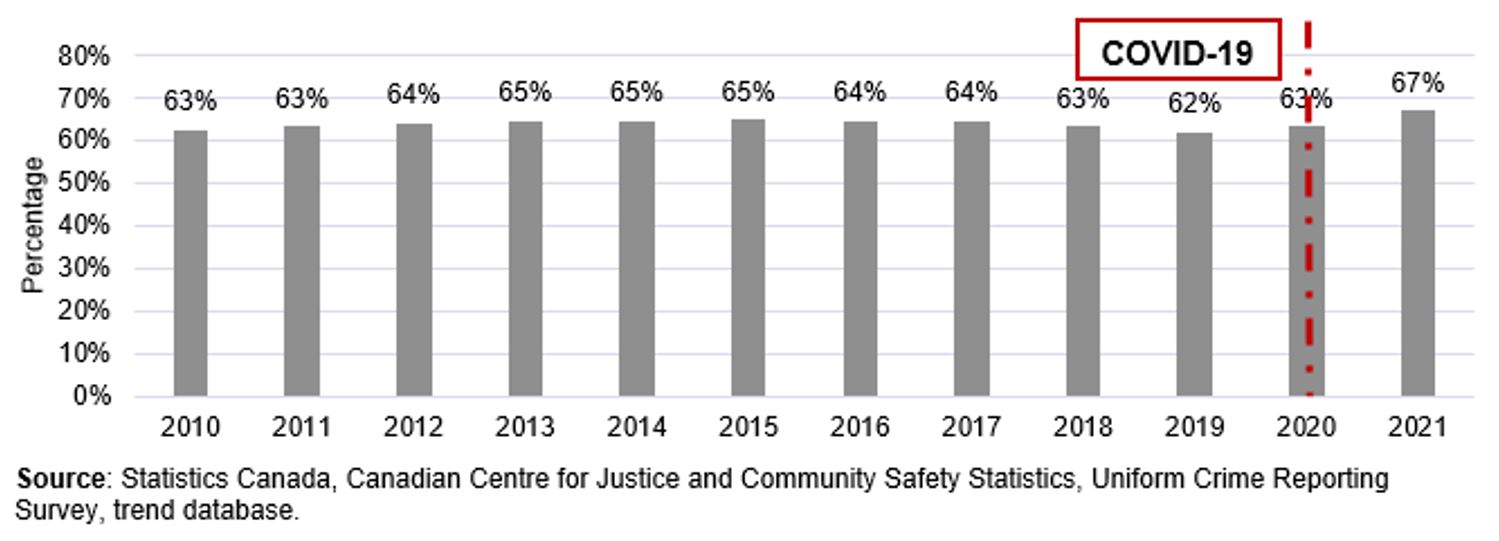
Verbal warnings were consistently the most frequently used EJM in Canada, ranging between 62% and 65% of all youth diverted by EJMs each year from 2010 to 2020, and reaching a peak of 67% in 2021 (see Chart 5).
Chart 5. Percentage of youth diverted by verbal warnings, among all youth diverted by EJMs, Canada, 2010 to 2021
Text version
This vertical bar chart displays the annual percentage of youth diverted by verbal warnings among all youth who were diverted through extrajudicial measures (EJMs) in Canada from 2010 to 2021. The horizontal axis lists each year from 2010 to 2021, and the vertical axis shows the percentage of verbal warnings issued, ranging from 0% to 80%.
Each bar represents the proportion of youth who received a verbal warning as their EJM for that year. The chart shows that verbal warnings consistently made up the majority of EJMs throughout the period.
- From 2010 to 2014, the percentage gradually increased from 63% to 65%, indicating a slight rise in the use of verbal warnings.
- Between 2016 and 2019, the percentage remained relatively stable at 64 or 65%, showing little variation.
- In 2020, marked by a red dashed vertical line indicating the COVID-19 pandemic, the percentage dipped slightly to 63%, suggesting a minor decline in verbal warnings during the pandemic’s onset.
- The largest increase occurred in 2021, when the percentage rose to 67%, a four-point jump from the previous year and the highest level recorded in the chart.
Source: Statistics Canada, Canadian Centre for Justice and Community Safety Statistics, Uniform Crime Reporting Survey, trend database.
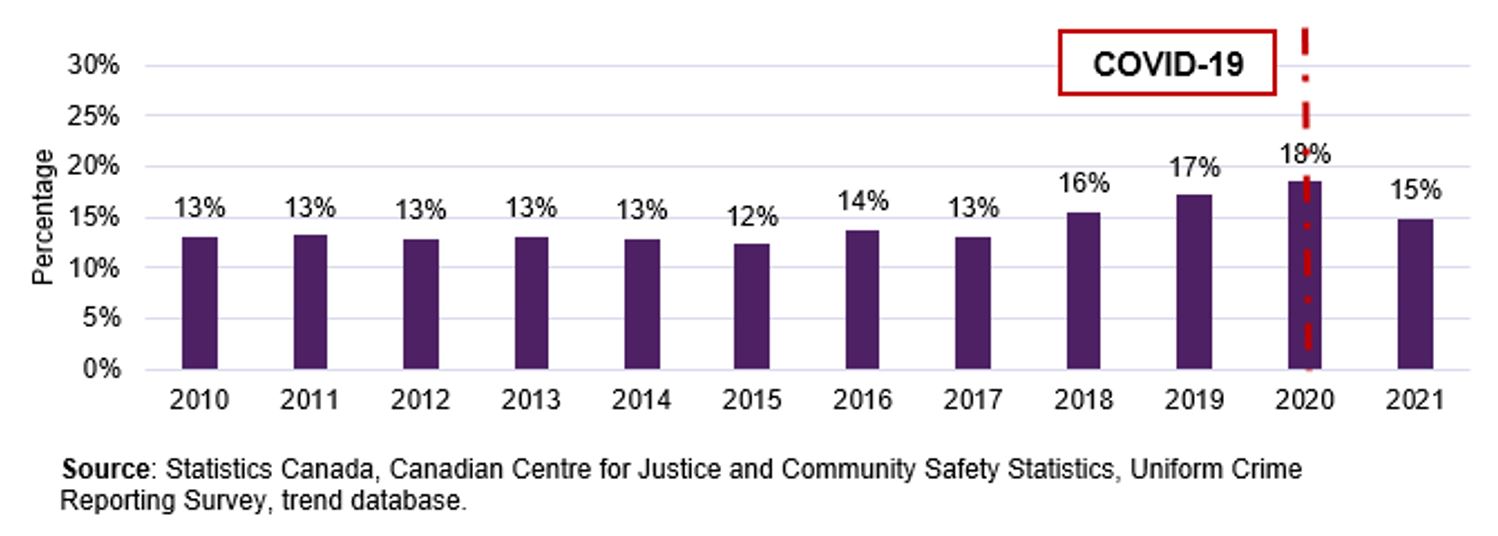
Referrals to an extrajudicial sanctions program—the second most frequently used EJM—remained somewhat stable until slight increases from 2018 to 2020
From 2010 to 2021, referrals to an extrajudicial sanctions program were the second most frequently used EJM in Canada, representing 14% of youth diverted by EJMs from 2010 to 2021 (see Chart 6). From 2010 to 2017, this percentage was stable, between 12% and 14%. The following year (2018), this percentage started increasing, reaching its peak in 2020 at 18%, before dropping in 2021 to 15%.
Chart 6. Percentage of youth diverted by referral to an extrajudicial sanctions program, among all youth diverted by EJMs, Canada, 2010 to 2021
Text version
This vertical bar chart displays the annual percentage of youth diverted by referral to an extrajudicial sanctions program among all youth who were diverted through extrajudicial measures (EJMs) in Canada from 2010 to 2021. The horizontal axis lists each year from 2010 to 2021, and the vertical axis shows the percentage of referrals, ranging from 0% to 30%.
Each bar represents the proportion of youth who were referred to an extrajudicial sanctions program for that year.
- From 2010 to 2014, the percentage remained stable at 13%, indicating consistent use of this type of diversion.
- In 2015, the percentage decreased slightly to 12%, marking the lowest point in the chart.
- From 2016 to 2018, the percentage gradually increased, returning to 13% in 2017 and 2017, then rising to 18% in 2020, the year marked by a red dashed vertical line indicating the COVID-19 pandemic.
- The largest increases occurred in 2017 and 2018, with the percentage climbing to 16% from 13%.
- In 2021, the percentage declined to 15%, indicating a slight reduction following the pandemic peak.
Source: Statistics Canada, Canadian Centre for Justice and Community Safety Statistics, Uniform Crime Reporting Survey, trend database.
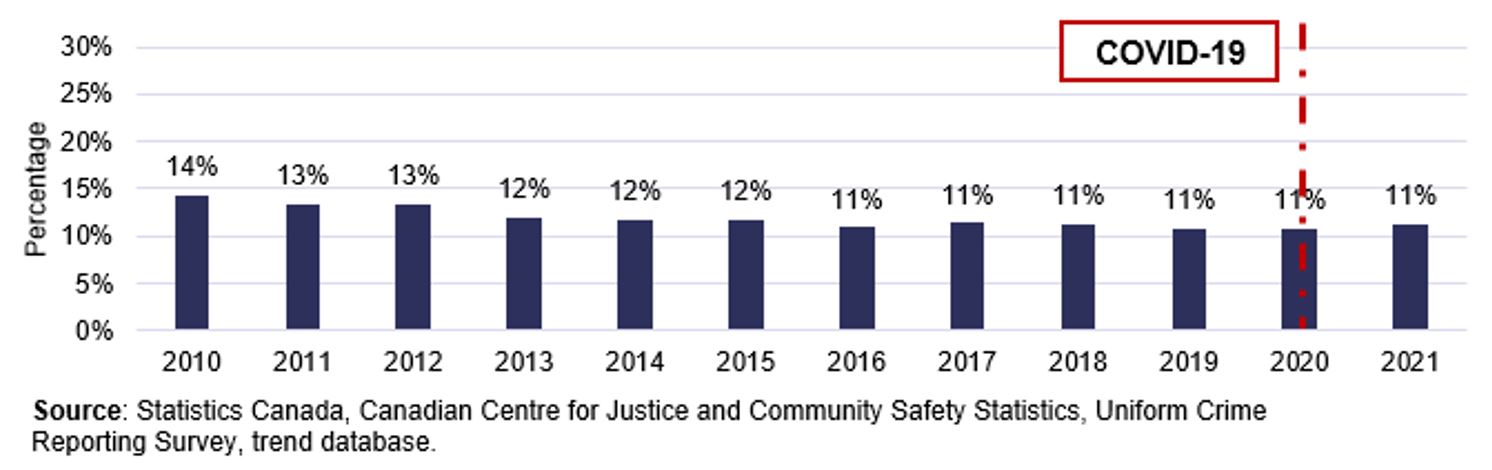
Written cautions—the third most frequently used EJM—remained rather stable over time
Written cautions were the third most reported type of EJM used from 2010 to 2021, representing 12% of youth diverted by EJMs during this time (see Chart 7). In 2010, this percentage was at its highest at 14%, but then slowly decreased over time reaching 11% in 2016, and stayed stable until the end of the study period.
Chart 7. Percentage of youth diverted by written caution, among all youth diverted by EJMs, Canada, 2010 to 2021
Text version
This vertical bar chart presents the annual percentage of youth diverted by written caution among all youth who were diverted through extrajudicial measures (EJMs) in Canada from 2010 to 2021. The horizontal axis lists each year from 2010 to 2021, and the vertical axis shows the percentage, ranging from 0% to 30%.
Each bar represents the proportion of youth who received a written caution as their EJM for that year.
- In 2010, the percentage was at its highest, at 14%.
- It decreased slightly to 13% in both 2011 and 2012, and then to 12% in 2013 and 2014.
- From 2015 onward, the percentage continued to decline, reaching its lowest point of 11%, which remained consistent through the following years up to 2021.
- A red dashed vertical line marks the year 2020, indicating the onset of the COVID-19 pandemic. However, there is no noticeable change in the percentage of written cautions following this event.
Source: Statistics Canada, Canadian Centre for Justice and Community Safety Statistics, Uniform Crime Reporting Survey, trend database.
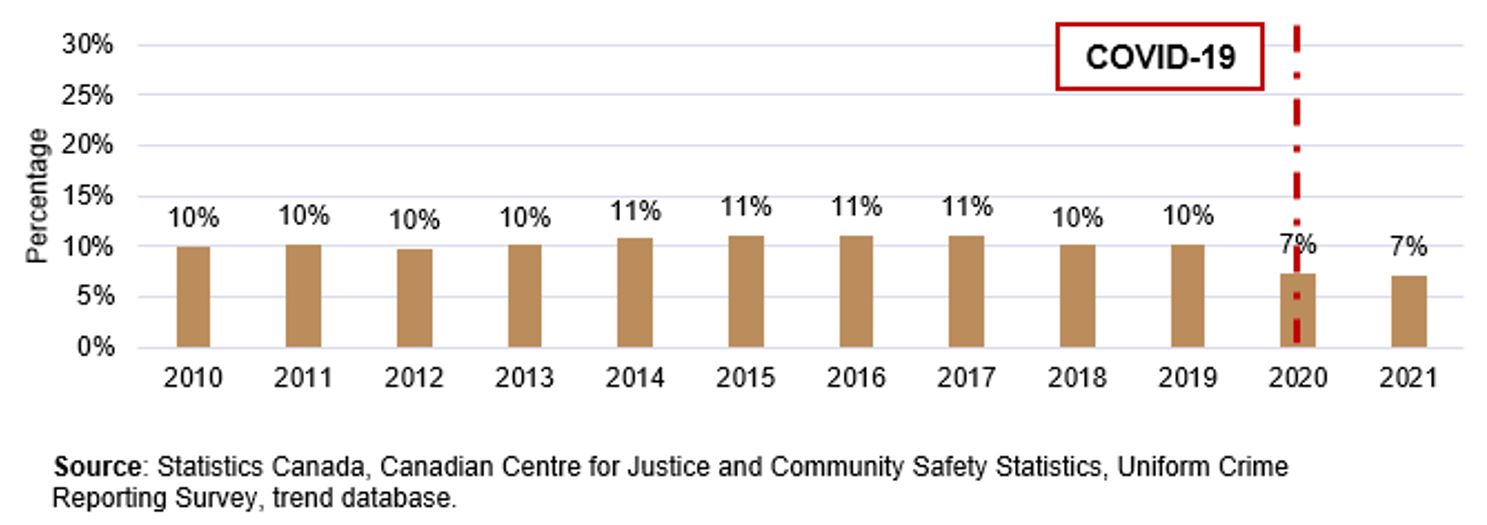
Referrals to a community program—the least frequently used EJM—also remained stable over the years, until 2020 where a drop was recorded
From 2010 to 2021, referrals to a community program were the least frequently used EJM in Canada, representing 10% of all youth diverted by EJMs from 2010 to 2021 (see Chart 8). This percentage was mostly stable over the years (varying between 10% to 11%), until 2020 where the percentage decreased to 7% and maintained this level in 2021.
Chart 8. Percentage of youth diverted by referral to a community program, among all youth diverted by EJMs, Canada, 2010 to 2021
Text version
This vertical bar chart presents the annual percentage of youth diverted by referral to a community program among all youth who were diverted through extrajudicial measures (EJMs) in Canada from 2010 to 2021. The horizontal axis lists each year from 2010 to 2021, and the vertical axis shows the percentage, ranging from 0% to 30%.
Each bar represents the proportion of youth who were referred to a community program as their EJM for that year.
- From 2010 to 2019, the percentage remained relatively stable, fluctuating slightly between 10% and 11%, indicating consistent use of community referrals during this period.
- In 2020, marked by a red dashed vertical line labeled "COVID-19", the percentage dropped sharply to 7%, reflecting a significant decline in referrals during the pandemic.
- This lower level of 7% persisted into 2021, suggesting that the impact of COVID-19 on community-based diversion programs continued beyond the initial year.
The biggest decrease occurred between 2019 and 2020, with a drop of approximately 3 percentage points, from around 10% to 7%.
Source: Statistics Canada, Canadian Centre for Justice and Community Safety Statistics, Uniform Crime Reporting Survey trend database.
4.3 How does the use of EJMs vary according to offence type?
The YCJA promotes the use of diversion through EJMs primarily for less serious offences; however, nothing precludes their use in dealing with more serious offences.Footnote 30 The following section provides an examination of the use of EJMs by most serious type of offence in the case: violent crimes,Footnote 31 property offences,Footnote 32 drug offences and other offencesFootnote 33. These trends, and how they have evolved over time, are further described below. Of note, due to small counts, analyses by the type of offence are only available by grouped years: 2010-2012, 2013-2015, 2016-2018 and 2019-2021.
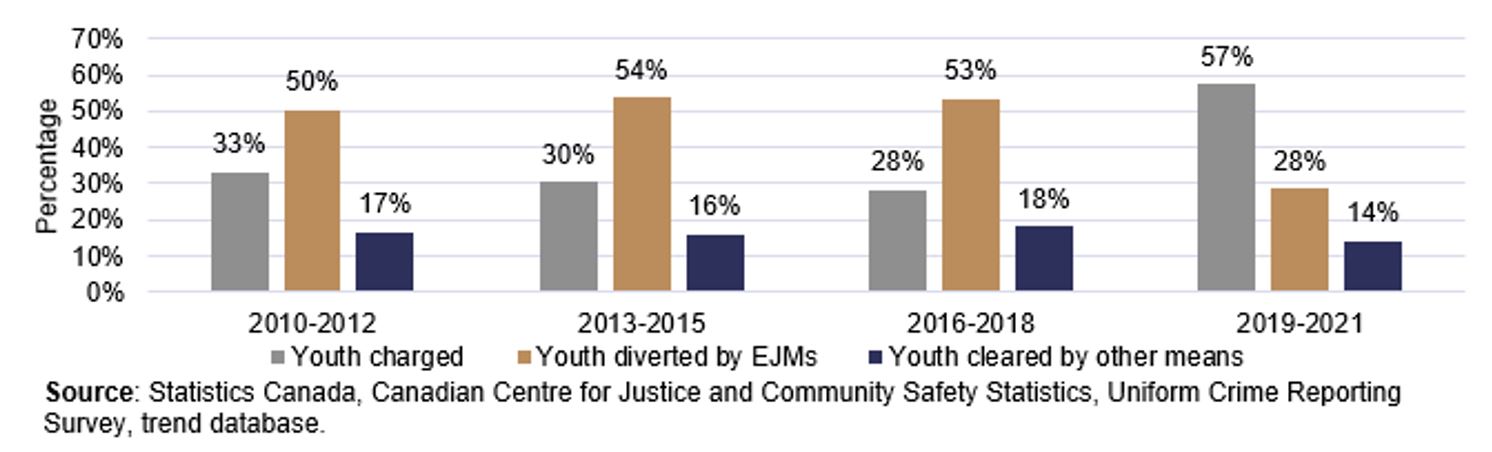
Half of all youth who came in contact with the police due to drug offences were diverted by EJMs, the highest proportion of any offence type
From 2010 to 2021, almost one-third (32%) of all youth who came in contact with the police due to drug offences were charged by police, while over half (51%) were diverted by EJMs and 17% were cleared by other means.
Over time, the percentage of youth charged for drug offences decreased from 33% in 2010-2012 to 28% in 2016-2018. In 2019-2021, this proportion sharply increased to over half (57%) of all youth who came in contact with the police due to drug offences. This led to a corresponding decrease in the use of EJMs (28% of youth in contact with police due to drug offences; see Chart 9).Footnote 34
Chart 9. Percentage of youth who came in contact with the police due to drug offences, by action taken by police, Canada, 2010-2012 to 2019-2021
Text version
This grouped bar chart presents the percentage of youth who came into contact with police due to drug offences, categorized by the type of police action taken, across four three-year periods: 2010–2012, 2013–2015, 2016–2018, and 2019–2021. The vertical axis shows percentages, ranging from 0% to 70%, while the horizontal axis lists the four time periods.
For each period, there are three bars representing different police responses:
- Youth charged:
- In 2010–2012, 33% of youth were charged.
- This percentage decreased slightly to 30% in 2013–2015, and again to 28% in 2016–2018.
- However, in 2019–2021, the percentage rose sharply to 57%, marking the largest increase across all categories and timeframes.
- Youth diverted by extrajudicial measures (EJMs):
- This category began at 50% in 2010–2012, increased to 54% in 2013–2015, and then slightly declined to 53% in 2016–2018.
- In 2019–2021, the percentage dropped dramatically to 28%, representing the most significant decrease in the chart—a fall of 26 percentage points from its peak.
- Youth cleared by other means:
- This category remained relatively stable, starting at 17% in 2010–2012, then slightly decreasing to 16% in 2013–2015, increasing to 18% in 2016–2018, and finally declining to 14% in 2019–2021.
Source: Statistics Canada, Canadian Centre for Justice and Community Safety Statistics, Uniform Crime Reporting Survey, trend database.
From 2010 to 2021, among youth who came in contact with the police due to drug offences who were diverted by EJMs, the majority (61%) were diverted by a verbal warning, 11% by a written caution, 13% by a referral to a community program and 15% by referral to an extrajudicial sanctions program. These trends remained stable throughout the study period, with the exception of 2019-2021, where there was a considerable drop in the use of verbal warnings (53%) and referrals to a community program (6%), with a corresponding increase in referrals to an extrajudicial sanctions program (35%).
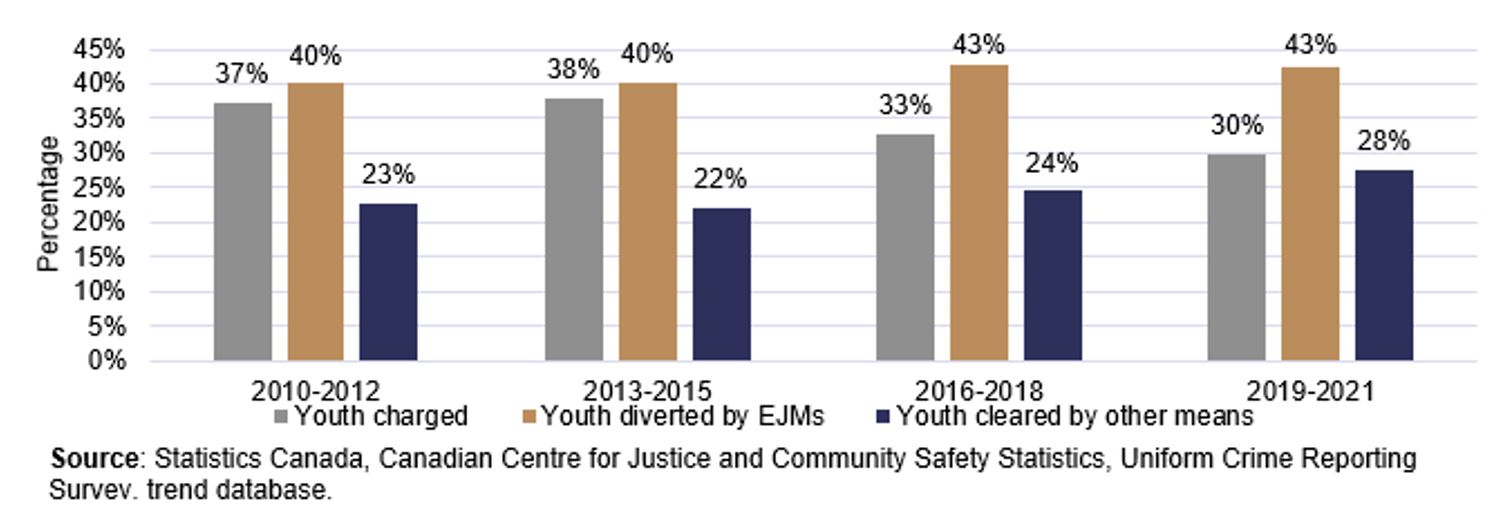
Two in five youth who came in contact with the police due to property offences were diverted by EJMs, the second most common offence type diverted by EJMs
From 2010 to 2021, over one-third (36%) of all youth who in came in contact with police due to property offences were charged by police, while about four in ten (41%) were diverted by EJMs and 23% were cleared by other means.
Over time, among all youth involved in property crimes, the percentage of youth charged decreased from 37% in 2010-2012 to 30% in 2019-2021, with corresponding increases in the use of EJMs (from 40% to 43%, respectively) and other means (from 23% to 28%, respectively) (see Chart 10).
Chart 10. Percentage of youth who came in contact with the police due to property offences, by action taken by police, Canada, 2010-2012 to 2019-2021
Text version
This grouped bar chart presents the percentage of youth who came into contact with police due to property offences, categorized by the type of police action taken, across four three-year periods: 2010–2012, 2013–2015, 2016–2018, and 2019–2021. The vertical axis shows percentages ranging from 0% to 45%, while the horizontal axis lists the four time periods.
For each period, there are three bars representing different police responses:
- Youth charged:
- In 2010–2012, 37% of youth were charged.
- This increased slightly to its highest level of 38% in 2013–2015.
- It then declined to 33% in 2016–2018, and further to 30% in 2019–2021 showing an overall decrease over time for this category.
- Youth diverted by extrajudicial measures (EJMs):
- This category remained stable at 40% in both 2010–2012 and 2013–2015.
- It then increased slightly to 43% in 2016–2018, and remained at 43% in 2019–2021 reflecting only a modest increase for this category.
- Youth cleared by other means:
- This category started at 23% in 2010–2012, then decreased slightly to 22% in 2013–2015.
- It then rose to 24% in 2016–2018, and increased further to its high of 28% in 2019–2021.
- This represents the largest increase among the three categories, with a 5 percentage point rise between the last two periods.
Source: Statistics Canada, Canadian Centre for Justice and Community Safety Statistics, Uniform Crime Reporting Survey trend database.
Of all youth involved in property offences diverted through EJMs, just under two-thirds (63%) were diverted by use of a verbal warning, 12% by written caution, 12% by referrals to a community program and 13% by an extrajudicial sanction. These trends remained stable throughout the study period.
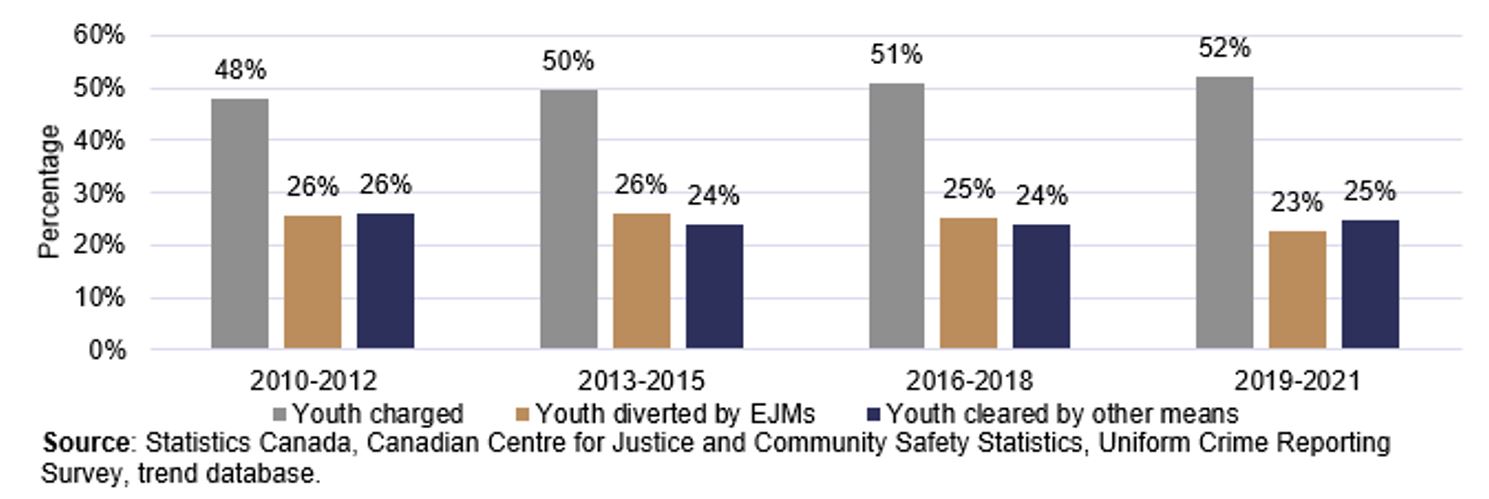
A quarter of all youth who came in contact with the police due to violent crimes were diverted by EJMs, while half were charged by police
From 2010 to 2021, half (50%) of all youth who came in contact with police due to violent crimes were charged, while a quarter (25%) were diverted by EJMs and another quarter (25%) were cleared by other means.
Over time, among youth involved in violent crimes, the percentage of youth charged increased slightly from 48% in 2010-2012 to 52% in 2019-2021, with a corresponding decrease in the use of EJMs (from 26% to 23%, respectively) (see Chart 11).
Chart 11. Percentage of youth who came in contact with the police due to violent crimes, by action taken by police, Canada, 2010-2012 to 2019-2021
Text version
This grouped bar chart presents the percentage of youth who came into contact with police due to violent crimes, categorized by the type of police action taken, across four three-year periods: 2010–2012, 2013–2015, 2016–2018, and 2019–2021. The vertical axis shows percentages ranging from 0% to 60%, while the horizontal axis lists the four time periods.
For each period, there are three bars representing different police responses:
- Youth charged:
- In 2010–2012, 48% of youth were charged.
- This percentage increased slightly to 50% in 2013–2015, and then to 51% in 2016–2018.
- In 2019–2021, the percentage rose further to a high of 52%.
- Youth diverted by extrajudicial measures (EJMs):
- This category started at 26% in 2010–2012, remained the same in 2013–2015, and then decreased slightly to 25% in 2016–2018.
- In 2019–2021, the percentage dropped further to 23%, representing the lowest percentage on the chart.
- Youth cleared by other means:
- This category began at the highest of the period at 26% in 2010–2012, then decreased slightly to the lowest at 24% in both 2013–2015 and 2016–2018.
- In 2019–2021, the percentage rose to back up to 25%.
Source: Statistics Canada, Canadian Centre for Justice and Community Safety Statistics, Uniform Crime Reporting Survey trend database.
Of all youth involved in violent crimes who were diverted by EJMs, under two-thirds (61%) were diverted by use of verbal warning, 13% by written caution, 8% by referrals to a community program and 17% by an extrajudicial sanction. These trends remained throughout the study period, with slight fluctuations in youth diverted through verbal warnings and extrajudicial sanctions.
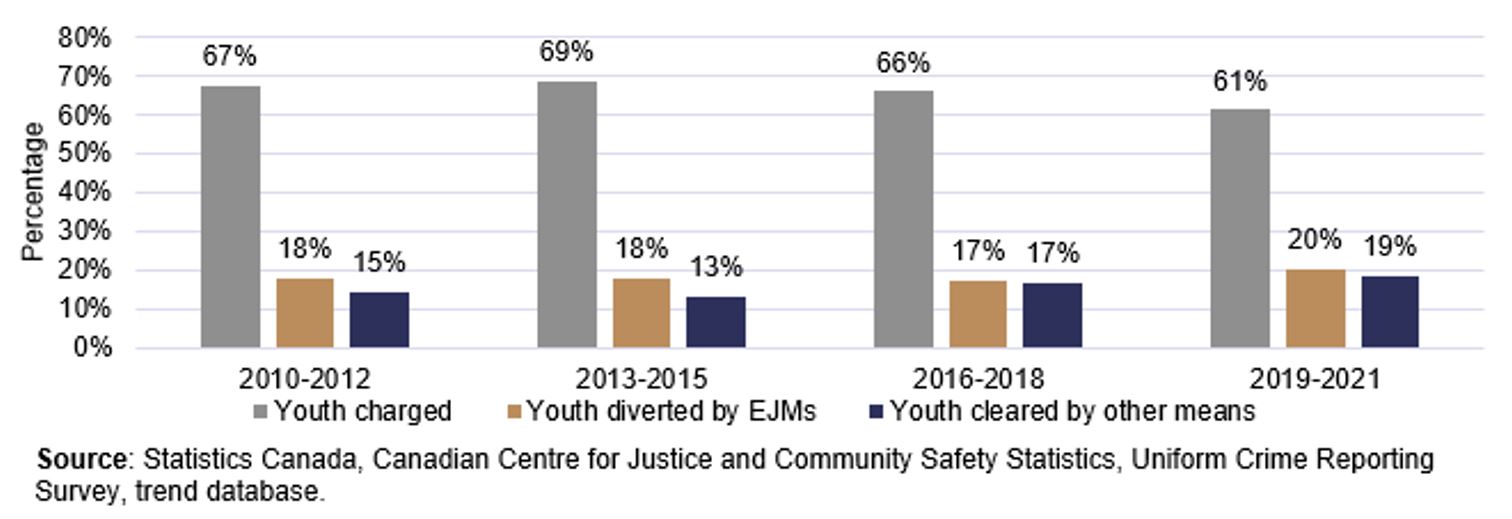
EJMs are least often used with youth in contact with police due to other offences
From 2010 to 2021, over two-thirds (67%) of all youth who came in contact with police due to other offences—which includes for example other Criminal Code violations such as administration of justice offences and disturbing the peace—were charged, while 18% were diverted by EJMs and 15% were cleared by other means.
These trends remained stable from 2010-2012 to 2016-2018. Afterwards, the percentage of youth charged decreased from 66% in 2016-2018 to 61% in 2019-2021, with slight corresponding increases among youth diverted by EJMs (from 17% to 20%, respectively) and youth cleared by other means (17% to 19%, respectively) (see Chart 12).
Chart 12. Percentage of youth who came in contact with the police due to other offences, by action taken by police, Canada, 2010-2012 to 2019-2021
Text version
This grouped bar chart presents the percentage of youth who came into contact with police due to “other offences”—offences not classified as violent, property, or drug-related—categorized by the type of police action taken, across four three-year periods: 2010–2012, 2013–2015, 2016–2018, and 2019–2021. The vertical axis shows percentages ranging from 0% to 80%, while the horizontal axis lists the four time periods.
For each period, there are three bars representing different police responses:
- Youth charged:
- In 2010–2012, 67% of youth were charged.
- This increased slightly to 69% in 2013–2015, the highest level recorded.
- It then declined to 66% in 2016–2018, and further to 61% in 2019–2021.
- Youth diverted by extrajudicial measures (EJMs):
- This category remained stable at 18% in both 2010–2012 and 2013–2015.
- It then slightly decreased to 17% in 2016–2018, before rising to 20% in 2019–2021.
- Youth cleared by other means:
- This category started at 15% in 2010–2012, then decreased to 13% in 2013–2015.
- It then rose to 17% in 2016–2018, and further to 19% in 2019–2021.
Source: Statistics Canada, Canadian Centre for Justice and Community Safety Statistics, Uniform Crime Reporting Survey trend database.
Of all youth involved in other offences who were diverted by EJMs, three-quarters (75%) were diverted by use of verbal warning, 15% by written caution, 7% by an extrajudicial sanction and 3% by referrals to a community program. These trends remained rather stable throughout the study period, although youth referred to an extrajudicial sanctions program increased from 5% in 2010-2012 to 10% in 2019-2021.
4.4 How does the use of EJMs vary between urban and rural regions?
The following section provides an examination of the use of EJMs by rural and urban regions. To do this, both rural and urban rates (which takes population size into account) of youth diverted by EJMs are examined and compared against each other, to generate a ratio. These trends, and how they have evolved over time, are further described below.
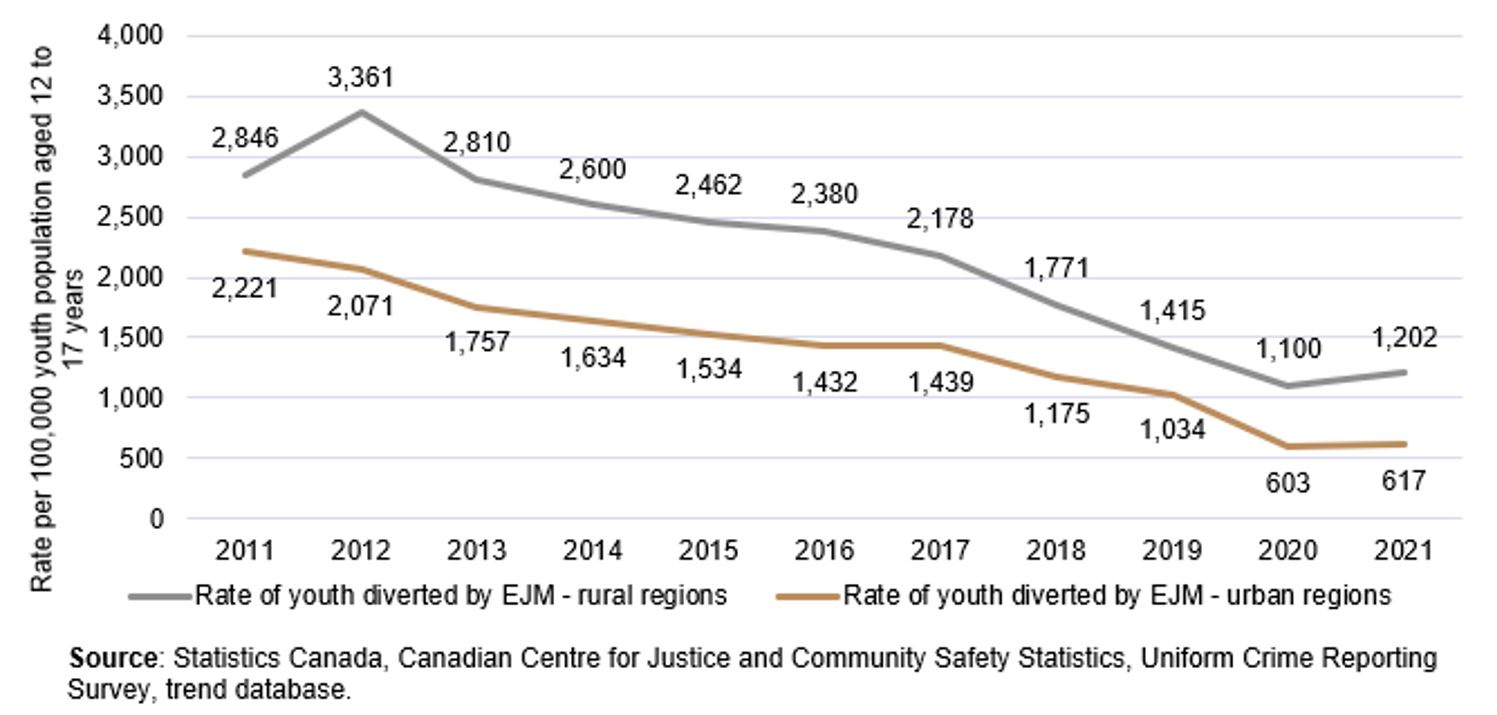
From 2011 to 2021, the rate of youth diverted by EJMs in rural regions was on average 1.6 times higher than the rate of those in urban regions (see Chart 13). The ratio fluctuated over time, ranging from 1.3 to 1.9 times higher in rural regions compared to urban regions. And notably, 2012 showed a spike in the use of EJMs in the rural regions only. Footnote 35 However, it is important to take into account the differences in police-reported crime across rural and urban regions and the difference in policing practices. Notably, rural areas vary in terms of their demographic, economic, and geographic characteristics, particularly between the rural provincial North and South. For more information on the characteristics of police-reported crimes in rural areas, see Statistics Canada’s Characteristics of police-reported crime in rural areas in the Canadian provinces, 2023.
Chart 13. Rural vs. urban rates of youth diverted by EJMs, Canada, 2011 to 2021
Text version
This line chart displays the annual rate of youth diverted by extrajudicial measures (EJMs) in rural and urban regions of Canada from 2011 to 2021. The horizontal axis represents the years from 2011 to 2021, and the vertical axis shows the rate per 100,000 youth aged 12 to 17, ranging from 0 to 4,000.
There are two lines plotted:
- Rural regions:
- The rural line begins at approximately 2,846 per 100,000 youth in 2011.
- It peaks in 2012 at around 3,361, the highest rate recorded in the chart.
- After 2012, the rate declines overall, with some fluctuations, reaching a low of approximately 1,100 in 2020, with a slight increase to 1,202 in 2021.
- The biggest decrease occurs between 2012 and 2013, where the rate drops from 3,361 to 2,810, a decline of over 500 points.
- Urban regions:
- The urban line starts at approximately 2,221 in 2011.
- It shows a steady downward trend over the years, with minor fluctuations.
- The rate reaches a low of 603 in 2020, then slightly increases to 617 in 2021, similar to the rural rate for that year.
- The largest drop for urban areas occurs between 2019 and 2020, falling from 1,034 to 603, a decrease of over 431 points.
Source: Statistics Canada, Canadian Centre for Justice and Community Safety Statistics, Uniform Crime Reporting Survey trend database.
Greater use of verbal warnings, written cautions and referrals to an extrajudicial sanctions program in rural regions, from 2011 to 2021
From 2011 to 2021, the rate of youth diverted by a verbal warning in rural regions was on average over 1.6 times higher than the rate of those in urban regions (see Chart 14). The ratio fluctuated over time, ranging from 1.4 to 2.0 times higher in rural regions compared to urban regions.
For youth diverted by a written caution, the rate in rural regions was on average over 2.4 times higher than the rate in urban regions from 2011 to 2021 (see Chart 15). The gap between rural and urban rates generally increased over time; in 2011 the rural rate was 1.7 times higher than the urban rate, and by 2021, the rural rate reached 3.5 times the urban rate.
For youth diverted by a referral to an extrajudicial sanctions program, the rate in rural regions was on average 1.4 times higher than the rate of those in urban regions from 2011 to 2021 (see Chart 16). However, the ratio varied over time; the rate in rural regions went from being 1.1 times higher than that in urban regions in 2011, to 1.7 times higher than that in urban regions in 2016. From 2017 to 2021, the ratio fluctuated between 1.2 and 1.5 times higher in rural regions compared to urban regions.
Chart 14. Rural vs. urban rates of youth diverted by a verbal warning, Canada, 2011 to 2021
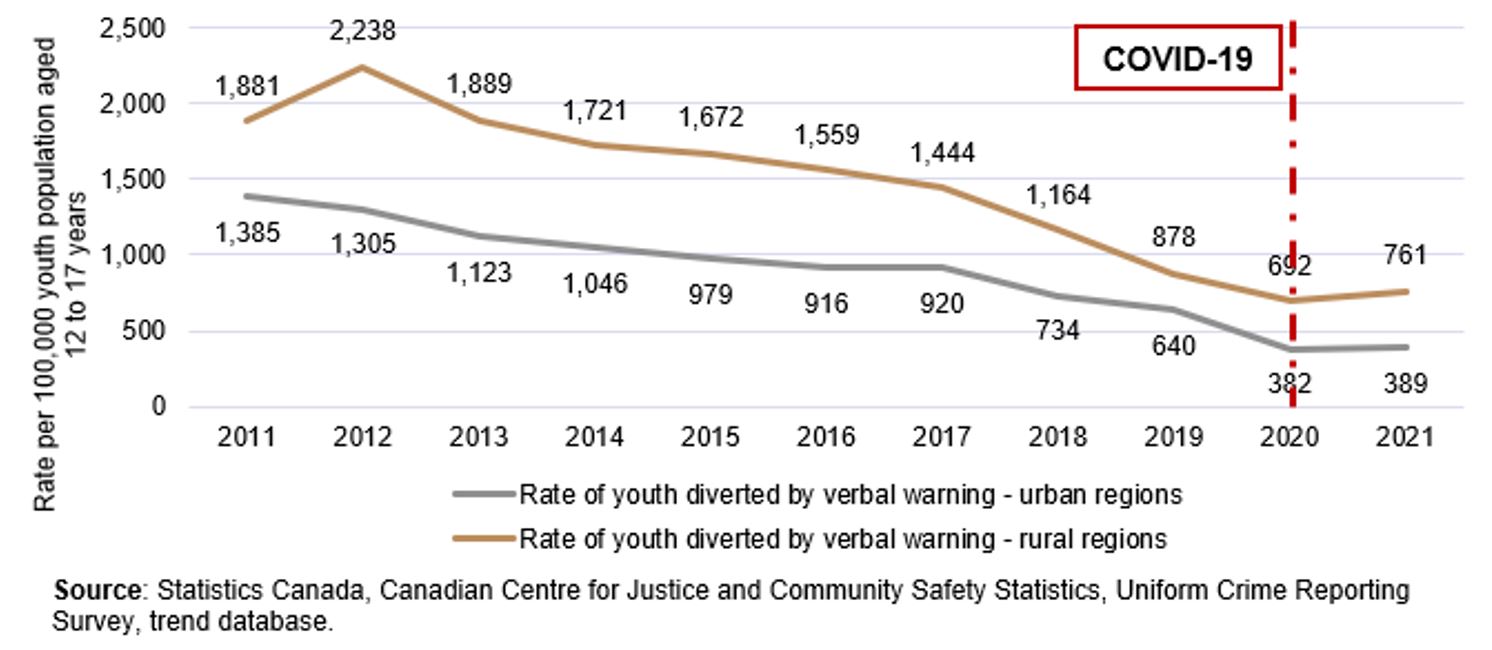
Text version
This line chart illustrates the annual rate of youth diverted by verbal warnings in urban and rural regions of Canada from 2011 to 2021. The horizontal axis represents the years, and the vertical axis shows the rate per 100,000 youth aged 12 to 17.
There are two lines plotted:
- Urban regions:
- The urban line begins at a rate of 1,385 per 100,000 youth in 2011.
- It shows a gradual decline over the decade, reaching its lowest point of 382 in 2020.
- In 2021, the rate slightly increases to 389.
- The largest decrease occurs between 2019 and 2020, where the rate drops from 734 to 382, coinciding with the COVID-19 pandemic, marked by a vertical dashed line on the chart.
- Rural regions:
- The rural line starts higher, at 1,881 in 2011, and peaks at 2,238 in 2012, the highest rate recorded in the chart.
- It then declines steadily, reaching a low of 692 in 2020, before rising to 761 in 2021.
- The biggest drop for rural areas also occurs between 2012 and 2013, falling from 2,238 to 1,889.
Source: Statistics Canada, Canadian Centre for Justice and Community Safety Statistics, Uniform Crime Reporting Survey trend database.
Chart 15. Rural vs. urban rates of youth diverted by a written caution, Canada, 2011 to 2021
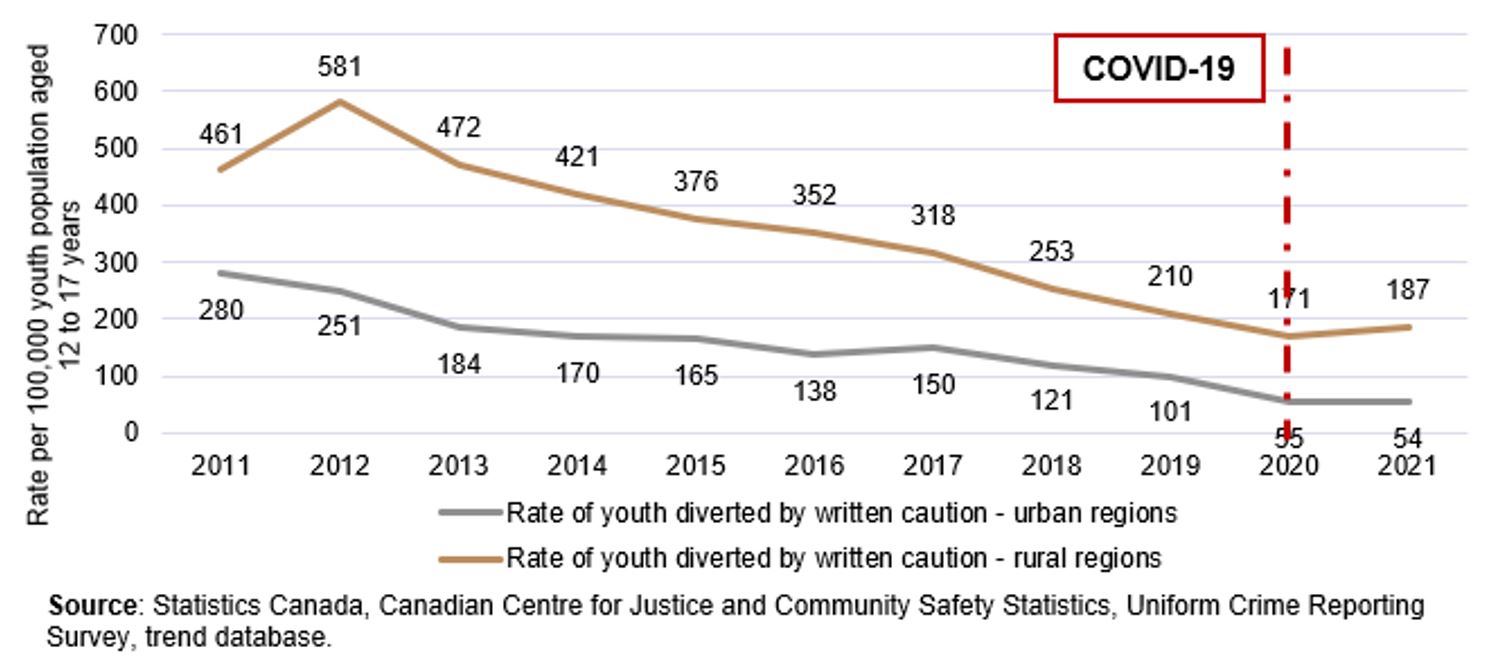
Text version
This line chart presents the annual rate of youth diverted by written cautions in urban and rural regions of Canada from 2011 to 2021. The horizontal axis shows the years, and the vertical axis represents the rate per 100,000 youth aged 12 to 17.
There are two lines plotted:
- Urban regions:
- The urban line begins at 280 per 100,000 youth in 2011.
- It shows a steady decline over the decade, reaching its lowest point of 54 in 2021.
- The biggest decrease occurs between 2012 and 2013 from 251 to 184.
- Rural regions:
- The rural line starts higher, at 461 in 2011, and peaks at 581 in 2012, the highest rate recorded in the chart.
- After 2012, the rate declines gradually, with some fluctuations, reaching a low of 171 in 2020, increasing slightly to 187 in 2021.
- The most significant drop for rural areas occurred in 2012 to 2013, from 581 to 472.
A vertical dashed line labeled "COVID-19" marks the period in early 2020, indicating a significant event that coincides with continued declines in both rural and urban rates.
Source: Statistics Canada, Canadian Centre for Justice and Community Safety Statistics, Uniform Crime Reporting Survey trend database.
Chart 16. Rural vs. urban rates of youth diverted by a referral to an extrajudicial sanctions program, Canada, 2011 to 2021
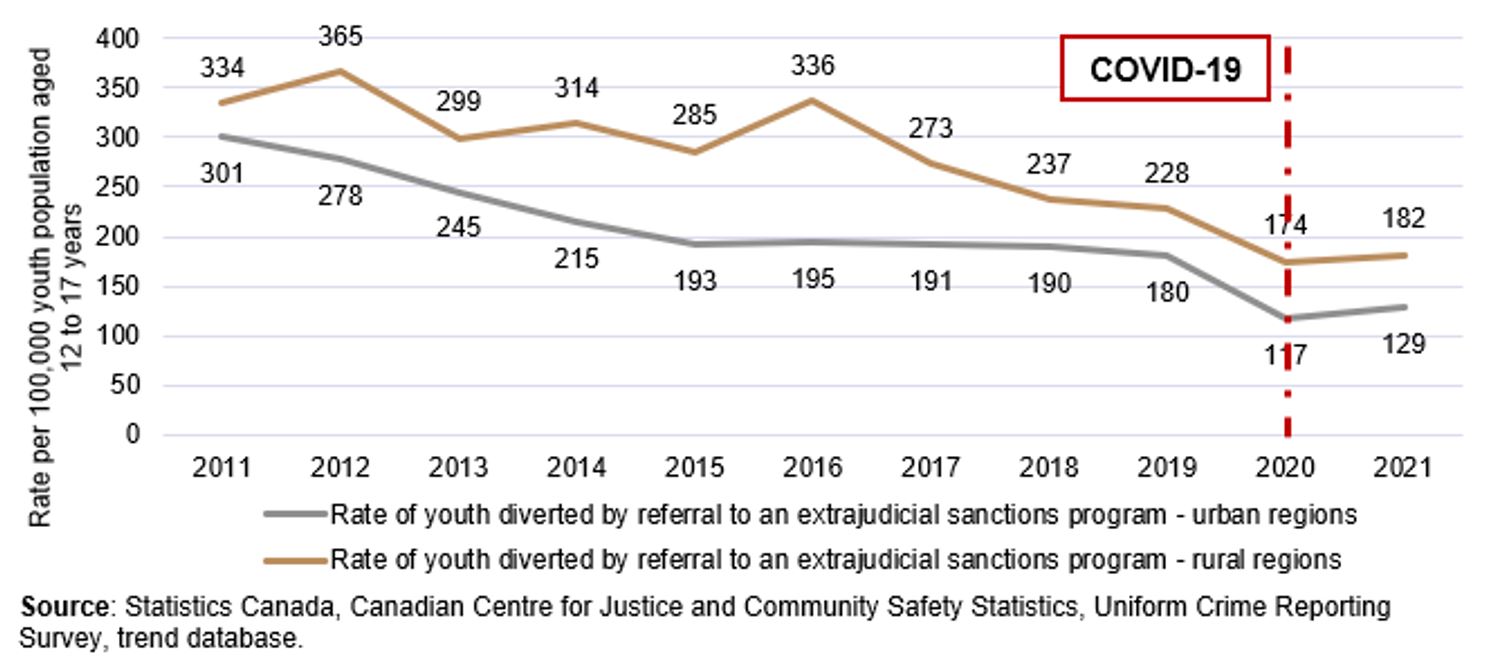
Text version
This line chart presents the annual rate of youth diverted by referral to an extrajudicial sanctions program in urban and rural regions of Canada from 2011 to 2021. The horizontal axis shows the years, and the vertical axis represents the rate per 100,000 youth aged 12 to 17.
There are two lines plotted:
- Rural regions:
- The rural line begins at 334 per 100,000 youth in 2011, and peaks at 365 in 2012.
- After 2012, the rate fluctuates, reaching another peak of 336 in 2016, followed by a steady decline.
- The lowest point is recorded in 2020, at approximately 174, coinciding with the COVID-19 pandemic, marked by a vertical dashed line, increasing slighty in 2021 to 182.
- The biggest decrease for rural regions occurs between 2012 and 2013, dropping from 365 to 299.
- Urban regions:
- The urban line starts at 301 in 2011, then declines gradually, falling to 117 in 2020, the lowest point for urban youth, then rising slightly in 2021 to 129.
- The most noticeable decrease for rural regions occurs between 2019 and 2020, dropping from 180 to 117.
Source: Statistics Canada, Canadian Centre for Justice and Community Safety Statistics, Uniform Crime Reporting Survey trend database.
Greater use of referrals to community programs in urban regions until 2019; greater use in rural regions in 2020 and 2021
From 2011 to 2021, the rate of youth diverted by a referral to a community program was slightly more prominent in urban regions, on average over 1.2 times higher than the rate in rural regions (see Chart 17). In 2011, the rate in urban regions was 1.5 times higher than the rate in rural regions; this ratio stayed overall stable until 2016. The following year (2017), the ratio slowly started to decrease. By 2020, the trend had completely inversed, with the rate of youth diverted by a referral to a community program more prominent in rural regions than urban regions (ratio of 1.3 in 2020 and 1.6 in 2021).
Chart 17. Rural vs. urban rates of youth diverted by a referral to a community program, Canada, 2011 to 2021
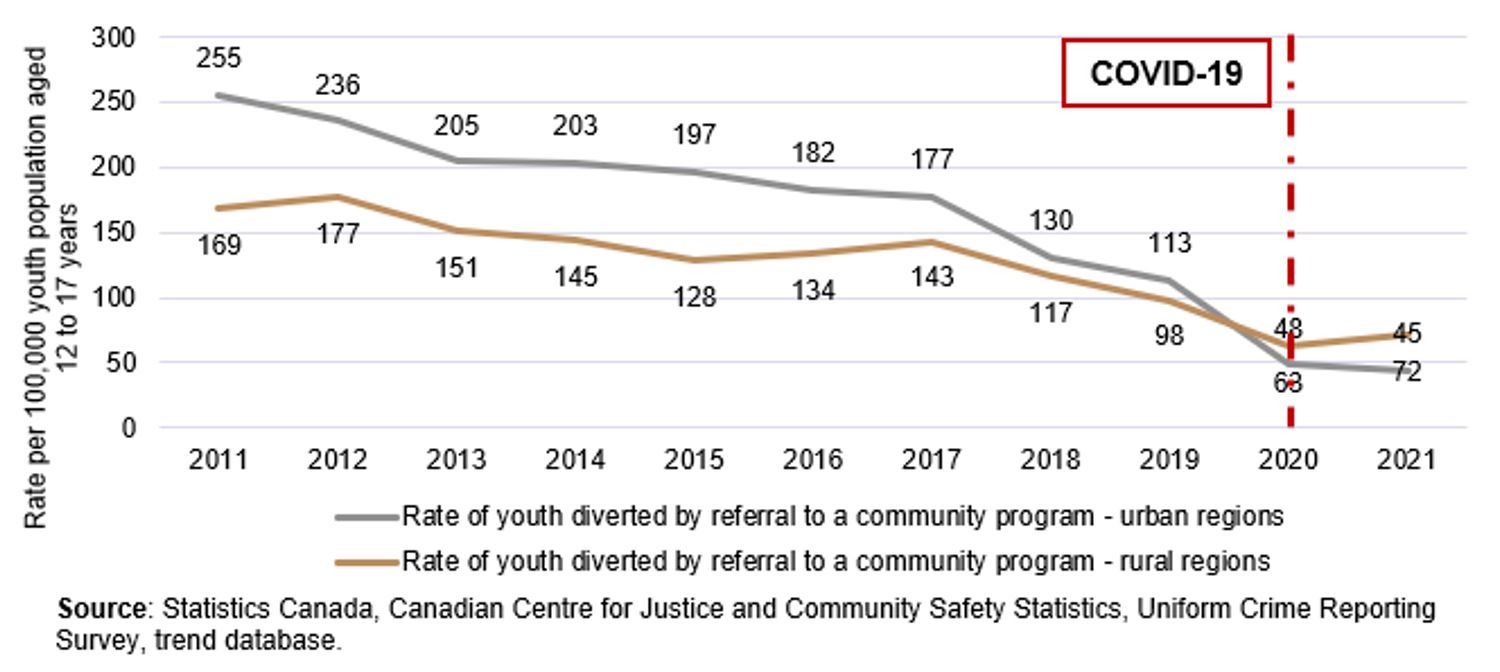
Text version
This line chart presents the annual rate of youth diverted by referral to a community program in urban and rural regions of Canada from 2011 to 2021. The horizontal axis shows the years, and the vertical axis represents the rate per 100,000 youth aged 12 to 17, ranging from 0 to 300.
There are two lines plotted:
- Urban regions:
- The urban line begins at approximately 255 per 100,000 youth in 2011.
- It shows a general downward trend over the decade, ending at around 45 in 2021.
- The most significant drop occurs between 2019 and 2020, of 112 to 48 coinciding with the COVID-19 pandemic, marked by a vertical dashed line on the chart.
- Rural regions:
- The rural line starts lower than urban, at approximately 169 in 2011.
- It also shows a declining trend over time, though with some fluctuations with a high of 177 in 2013 down to its lowest point in 2021, at 68.
Source: Statistics Canada, Canadian Centre for Justice and Community Safety Statistics, Uniform Crime Reporting Survey trend database.
4.5 Are there any jurisdictional differences in the use of EJMs?
The following section examines jurisdictional differences in the use of EJMs, by comparing jurisdictional trends to national trends for the following three areas: 1) volume and severity of youth crime; 2) action taken by police: youth charged, youth diverted to EJMs and youth cleared by other means; and 3) types of EJMs used. This section provides a high-level summary of key findings. Data tables are available in Annex II.
Atlantic region observed higher percentages of youth diverted by EJMs, but lower percentages of youth cleared by other means compared to national trends
Provinces in the Atlantic regionFootnote 36 generally saw slightly lower percentages of their youth charged in comparison to that observed at the national level. However, some jurisdictions (Newfoundland and Labrador (NFLD) and Prince Edward Island (PEI)) saw increases in youth charged the later years, where at times over half of all youth who came in contact with the police were charged, surpassing the national levels. The Atlantic region also recorded a higher percentage of youth diverted by use of EJMs—primarily for drug and property offences—but a lower percentage of youth cleared by other means. Looking at the different types of EJMs used, compared to national trends, NFLD most notably recorded a higher usage of verbal warnings; PEI saw a slightly higher use of referrals to a community program; Nova Scotia (NS) had a lower use of referrals to a community program; and, New Brunswick (NB) a higher use of referrals to an extrajudicial sanctions program.
Quebec observed lower percentages of youth diverted by EJMs, but higher percentages of youth cleared by other means compared to national trends
Quebec(QC) generally saw similar or lower percentages of their youth charged in comparison to that observed at the national level. QC also recorded a lower percentage of youth diverted by use of EJMs—primarily for drug and property offences—but a higher percentage of youth cleared by other means. Looking at the different types of EJMs used in comparison to the national trends, QC notably recorded a higher use of referrals to an extrajudicial sanctions program, and very little usage of written cautions.
Ontario observed higher percentages of youth diverted by EJMs, but lower percentages of youth cleared by other means compared to national trends
Ontario (ON) generally saw similar or higher percentages of youth charged in comparison to that observed at the national level. This was particularly the case in 2020 and 2021, where ON recorded charges for over half (52% and 50%, respectively) of all youth who came in contact with the police. ON also recorded a higher percentage of youth diverted by use of EJMs—primarily for drug and property offences—but a lower percentage of youth cleared by other means. Looking at the different types of EJMs used in comparison to the national trends, ON notably recorded a higher usage of written cautions and referrals to a community program.
The Prairies region observed lower percentages of youth diverted by EJMs, but higher percentages of youth cleared by other means compared to national trends
Provinces in the Prairies regionFootnote 37 generally saw higher percentages of their youth charged in comparison to that recorded at the national level.Footnote 38 Jurisdictions in the Prairies region also recorded a lower percentage of youth diverted by use of EJMs—primarily for drug and property offences—but higher percentage of youth cleared by other means. Looking at the different types of EJMs used in comparison to the national trends, the Prairies most notably recorded a higher usage of verbal warnings and written cautions.
British Columbia observed higher percentages of youth diverted by EJMs and higher percentages of youth cleared by other means compared to national trends
British Columbia (BC) saw lower percentages of youth charged in comparison to that observed at the national level. BC also recorded a higher percentage of youth diverted by EJMs—primarily for drug and property offences—as well as a higher percentage of youth cleared via other means. Looking at the different types of EJMs used in comparison to the national trends, BC notably recorded a higher usage of verbal warnings.
The Territories observed higher percentages of youth diverted by EJMs and much higher percentages of youth cleared by other means compared to national trends
Jurisdictions in the TerritoriesFootnote 39 saw much lower percentages of youth charged in comparison to that observed at the national level, despite higher volume and severity of crime.Footnote 40 The Territories also observed a higher percentage of youth diverted by EJMs—primarily for drug and property offences—as well as much higher percentage of youth cleared via other means. Looking at the different types of EJMs used in comparison to the national trends, Northwest Territories (NWT), Yukon (YK) and Nunavut (NU) most notably recorded a higher usage of verbal warnings and written cautions.
- Date modified: