
3. Background
To understand trends in the use of EJMs, it is important to first consider trends in youth crime and police charging practices more broadly. To do this, data pertaining to youth crime trends and police charging practices pre- and post-YCJA (1998 to 2021) were examined. The following section presents findings for three key youth crime indicators:
- Youth crime rate is a measure of the volume of crime and is calculated by combining the per capita rate of youth charged and youth not charged.
- Rates of youth charged and youth not charged (which includes instances where the police decided to divert the youth from the CJS by using an EJM or to clear them by other means)Footnote 20; and
- Youth Crime Severity Index (CSI), which measures year-to-year changes in the level of seriousness of youth crime, while also accounting for the volume of youth crime.Footnote 21
Note: Since the time of data analysis and reporting, new police data from 2022 and 2023 were released which indicates an increase (32%; see page 13) in youth crime since 2021 (the last year of the study period). Ongoing monitoring of these data will be needed to determine if this is indicative of a new emerging trend in youth justice, and its impact on the use of EJMs.
Following the enactment of the YCJA, the youth crime rate showed decreases until 2021
Prior to the enactment of YCJA, data show the youth crime rate generally increased from 7,611 per 100,000 youth population in 1998 to 7,930 in 2002, representing a 4% increase during this time. In 2003, following the enactment of the YCJA, the trend completely inversed, with the youth crime rate showing a steady decrease (-72%) from 8,207 per 100,000 youth in 2003 to 2,305 in 2021. This overall decrease was mostly due to decreases in property crimes, such as theft of property $5,000 or under, breaking and entering, theft of a motor vehicle, possession of stolen property, fraud, arson, mischief, as well as drug offences.Footnote 22
Rate of youth charged by police decreased post-YCJA; Youth who came in contact with the police were more likely to not be charged than charged following enactment
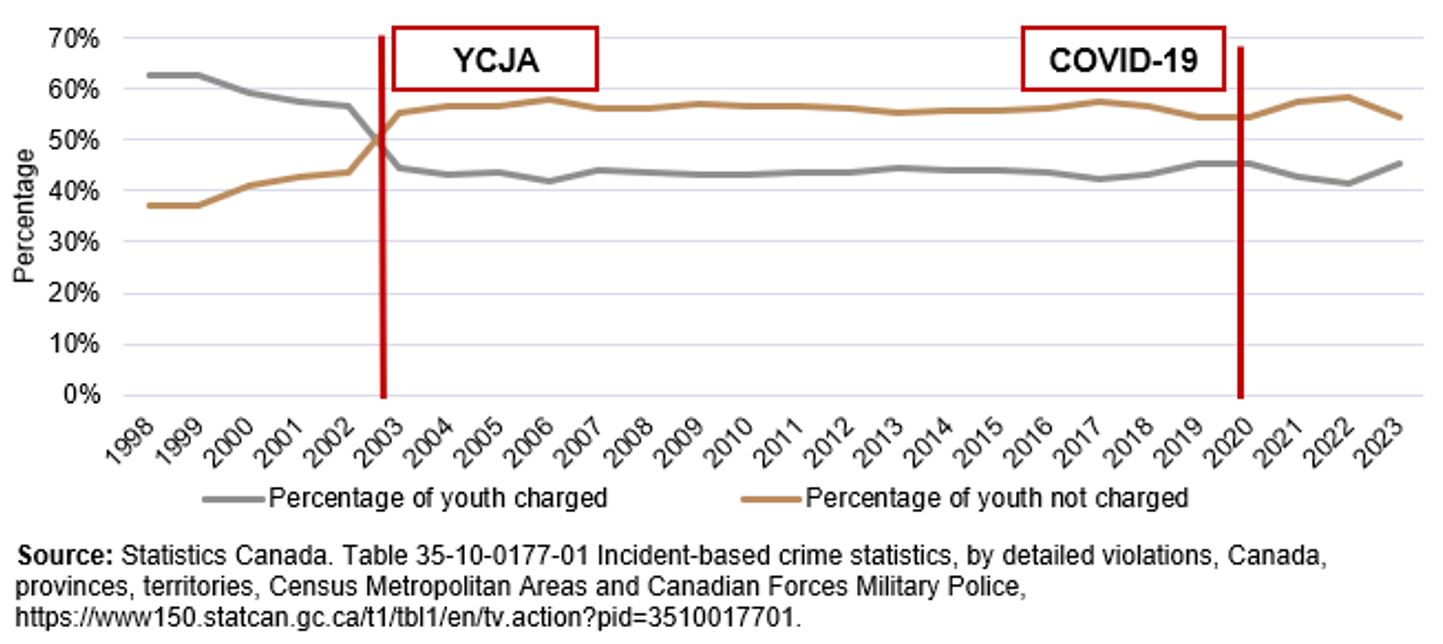
Looking specifically at police charging practices, similar to the youth crime rate, both the rate of youth charged and youth not charged decreased over the study period. However, a more meaningful way of examining trends in police charging practices is by looking at the proportion of youth who were charged versus the proportion of youth who were not charged (see Chart 1). The pre-YCJA years showed that in 1998 and 1999, 63% of all youth who came in contact with the police were charged, while 37% were not charged. This percentage started a decreasing trend in the following years leading up to the enactment of the YCJA, but remain above 50% until 2002 (56%). Then, following the enactment of the YCJA in 2003, the trend in policing charging practices reversed, with less than half (45%) of all youth who came in contact with the police were charged, while the remaining 55% were not. This trend stayed rather stable from 2003 to 2021 (the end of the study period).
Youth crime severity also decreased in post-YCJA years until 2021
Similar to the youth crime rate, the Youth CSI showed an overall decrease in crime severity after the enactment of the YCJA. From 2003 to 2021, the Youth CSI decreased 61%, from an index value of 106 to 41, respectively.Footnote 23 This was largely due to the 78% decrease in the Youth Non-Violent CSI (from an index value of 116 in 2003 to 25 in 2021).Footnote 24 In comparison, the Youth Violent CSI decreased 31% during this time (from an index value of 93 in 2003 to 64 in 2021).Footnote 25
As previously noted, the latest available UCR data from 2022 and 2023 show an increase in the volume and severity of youth crime. Specifically, the volume of crime (i.e., youth crime rate) increased 32%, from 2,305 per 100,000 youth population in 2021 to 3,049 per 100,000 in 2023. Similarly, the Youth CSI increased 31% from 2021, to an index value of 54 in 2023; this was primarily the result of an increase (+34%) in the Youth Violent CSI, although the Non-Violent CSI also saw an increase (+24%).
It is important to note that the causes of changes in the volume and severity of crime in recent years may be partly explained by various factors such as social and economic contexts, events, and movements that may have impacted the number and types of crime being committed and/or reported.Footnote 26
Chart 1. Percentage of youth charged and youth not charged among all youth who came in contact with the police, Canada, 1998 to 2023
Text version
The chart is a line graph that tracks the percentage of youth charged versus not charged by police in Canada from 1998 to 2023. The horizontal axis (x-axis) represents the years, starting at 1998 and ending at 2023. The vertical axis (y-axis) represents the percentage of youth, ranging from 0% to 70%.
There are two lines on the graph:
- One line represents the percentage of youth charged.
- The other line represents the percentage of youth not charged (i.e., those who received extrajudicial measures).
At the beginning of the timeline in 1998, the percentage of youth charged is significantly higher than the percentage not charged. Around 2003, a vertical marker labeled "YCJA" (Youth Criminal Justice Act) indicates the policy change. After this point, the line for youth charged declines sharply, while the line for youth not charged rises steadily. The two lines cross shortly after 2003, indicating that from that point onward, more youth were not charged than were charged.
A second vertical marker appears around 2020, labeled "COVID-19", indicating the onset of the pandemic. Around this time, both lines show minor fluctuations, but no dramatic shifts.
The most significant trend in the chart is the sharp decrease in the percentage of youth charged following the implementation of the YCJA in 2003. This is mirrored by a notable increase in the percentage of youth not charged, suggesting a shift toward the use of extrajudicial measures.
Source: Statistics Canada, Table 35-10-0177-01: Incident-based crime statistics, by detailed violations, Canada, provinces, territories, Census Metropolitan Areas and Canadian Forces Military Police.
Note: While trends in this chart examine the period from 1998 to 2023 for contextual purposes, the rest of the report focuses on the time period of 2010 to 2021.
- Date modified: